High Tide vs Slack Tide: What NOAA Predicts
High tide vs slack tide: one is a water height NOAA predicts, the other is a current with no horizontal motion, and the two do not share a clock.
Searching high tide vs slack tide usually means one of two things went wrong: either a tide table was used to plan something that actually depended on the current, or two sources disagreed about when the water would stop moving. Both problems come from the same place. High water and slack water are different physical quantities, NOAA predicts them from two separate products, and the times they fall on do not line up in any way you can work out from a tide table alone.
This guide separates the two, shows what a tide prediction does and does not contain, and uses the stored seven-day sample behind this site to show how unevenly the water moves across a single tide.
What NOAA predicts when you ask for a tide
A tide prediction is a water height against time. NOAA's glossary defines high water as "The maximum height reached by a rising tide" and low water as "The minimum height reached by a falling tide." Those are vertical measurements: the position of the surface, in feet above a datum, at a particular station.
The datum matters more than people expect. US tide predictions are referenced to mean lower low water, which the same glossary describes as "A tidal datum. The average of the lower low water height of each tidal day observed over the National Tidal Datum Epoch." So a predicted 2.18 ft is not two feet of water. It is a surface sitting 2.18 ft above the long-term average of the lower of each day's two low waters. Depth at any point is whatever the chart gives for that point, plus the predicted height.
When this site requests predictions it asks for interval=hilo, which returns only the extremes: one row per high water and one per low water. The CO-OPS Data API documentation describes that interval as "High and low tide times and heights", and notes that subordinate stations can only use it. So the raw material of almost every tide table you have ever seen is four numbers a day, and everything else — the curve, the "tide is now rising" line, the shaded band — is drawn between them by whoever built the page.
That is the honest limit of a tide prediction. It tells you where the surface is expected to be. It says nothing at all about which way, or how fast, the water is travelling horizontally.
High tide vs slack tide: two different quantities
Horizontal motion is the current, and NOAA treats it as a different thing entirely. The glossary defines a flood current as "The movement of a tidal current toward the shore or up a tidal river or estuary" and an ebb current as "The movement of a tidal current away from shore or down a tidal river or estuary." Between a flood and an ebb there is a turn, and that is where slack water lives. NOAA's Tides and Currents FAQ puts it in one sentence: "There are also periods when there is little or no horizontal motion of the water; this is called 'slack water'."
Read those definitions next to each other and the distinction becomes concrete:
| Quantity | What it describes | Units | NOAA product | On this site |
|---|---|---|---|---|
| High water | Highest surface height reached by a rising tide | Feet above MLLW | Tide predictions, product=predictions |
Yes, on every station page |
| Low water | Lowest surface height reached by a falling tide | Feet above MLLW | Tide predictions, product=predictions |
Yes, on every station page |
| Flood current | Water moving toward shore or up an estuary | Knots, with a direction | Tidal current predictions, a separate product and separate stations | No |
| Ebb current | Water moving away from shore or down an estuary | Knots, with a direction | Tidal current predictions, a separate product and separate stations | No |
| Slack water | Period of little or no horizontal motion | A time window, not a height | Tidal current predictions | No |
The right-hand column is the uncomfortable part, and it is deliberate. TideCurve publishes tide heights. It does not publish current predictions, and it will not infer slack water times from heights, because the data does not support it.
Why high tide and slack tide do not share a clock
The intuition that trips people up is reasonable: if the water has stopped rising, surely it has stopped moving. In a bathtub that would hold. In a real coastline it often does not, and NOAA is unusually blunt about it. From the same FAQ: "The relationship between the times of high/low tide and the times of slack water or maximum current is not a simple one."
The agency also notes that "tide predictions and tidal current predictions are generated separately." Two separate products, two separate station networks, two separate sets of harmonic analysis. If the timing could be derived from the heights, there would be no reason to maintain both.
The physical reason is that a tide is a long wave arriving at a coast, and the water filling a bay has to get there through a gap. In a basin connected to the ocean by a narrow channel, the basin keeps filling after the ocean outside has peaked, because the pressure difference that drives the flow has not reversed yet. The current through the channel turns when that difference reverses, not when the height outside reaches its maximum. How far apart those two moments fall depends on the shape of the channel and the basin, which is exactly the kind of local geometry that cannot be read off a height table.
Worth noting from NOAA's currents tutorial: "Tidal currents are the only type of currents that change in a very regular pattern and can be predicted for future dates." Tidal currents are predictable. They are just predictable from current data, not from tide heights.
What one falling tide actually looks like
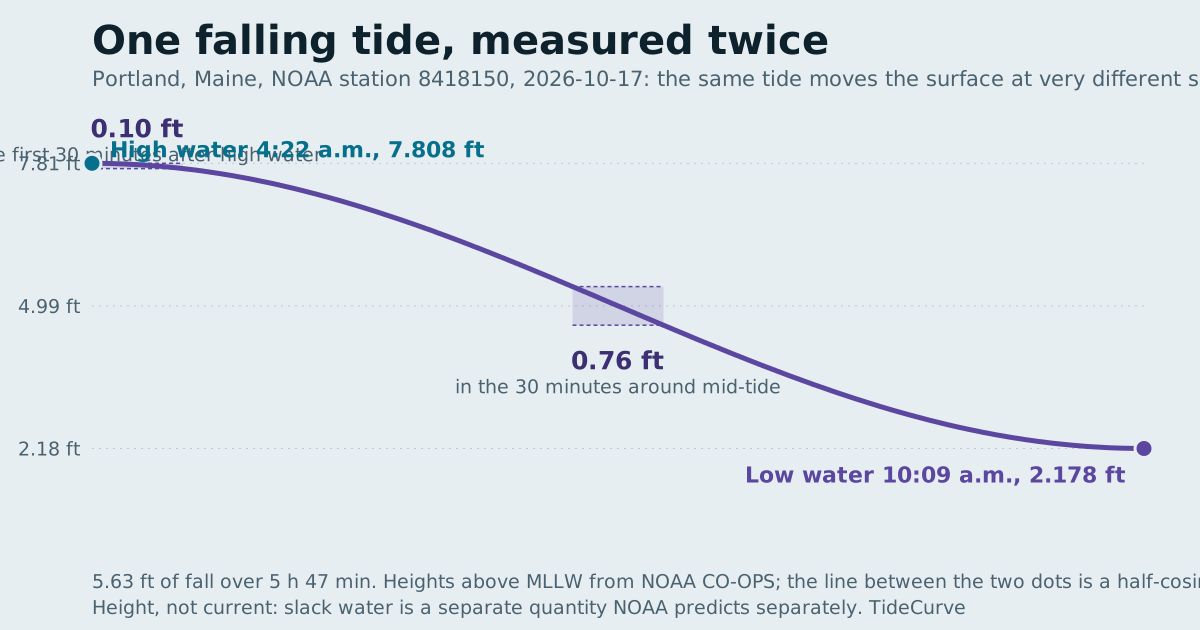
The figure at the top of this page takes a single limb — one high water to the next low water at Portland, Maine, NOAA station 8418150, on 17 October 2026 — and measures the surface drop across two thirty-minute windows.
In the first thirty minutes after high water, the predicted surface falls about 0.10 ft. In the thirty minutes centred on mid-tide, it falls about 0.76 ft, roughly seven times as much, over the same half hour of the same tide. The whole limb is 5.63 ft of fall over 5 h 47 min.
This is the source of the "the tide has stopped" feeling at high water. Near an extreme the rate of height change really does approach zero, so a mark on a piling or a rock barely moves for twenty minutes or more. That stillness is vertical. It is not a statement about the current, and treating it as one is precisely the mistake the high tide vs slack tide question is trying to avoid.
One caveat about that figure, stated plainly because it would be easy to overclaim: NOAA's hilo product gives the two dots, not the line between them. The curve is a half-cosine interpolation, the standard sinusoidal approximation of a tidal limb, and the two bracketed measurements are computed from it. The shape of the finding — slow at the ends, fast in the middle — is a property of any sinusoidal tide, and the endpoints are NOAA values. The exact hundredths are approximations, and the methodology page says so in the same words.
The same hour, ten different tides
If a single clock time meant the same thing along a coast, one table would do for everyone. The stored sample says otherwise. Below is the first high water of 17 October 2026 at ten stations on the list, the low water that followed it, and the drop between them — all values as NOAA returned them.
| Station | First high water | Next low water | Time between | Fall |
|---|---|---|---|---|
| Eastport, ME | 3:58 a.m. | 10:10 a.m. | 6 h 12 min | 12.47 ft |
| Bangor, ME | 3:51 a.m. | 10:26 a.m. | 6 h 35 min | 8.94 ft |
| Bar Harbor, ME | 3:55 a.m. | 9:55 a.m. | 6 h 00 min | 6.66 ft |
| Boston, MA | 4:31 a.m. | 10:24 a.m. | 5 h 53 min | 5.78 ft |
| Portland, ME | 4:22 a.m. | 10:09 a.m. | 5 h 47 min | 5.63 ft |
| Hampton Harbor, NH | 4:36 a.m. | 10:41 a.m. | 6 h 05 min | 5.12 ft |
| Bath, ME | 5:03 a.m. | 11:10 a.m. | 6 h 07 min | 4.53 ft |
| Chatham, MA | 5:33 a.m. | 11:25 a.m. | 5 h 52 min | 3.37 ft |
| Nantucket Island, MA | 5:45 a.m. | 11:07 a.m. | 5 h 22 min | 1.56 ft |
| Woods Hole, MA | 1:20 a.m. | 4:06 a.m. | 2 h 46 min | 0.47 ft |
Three things in that table are worth sitting with. The first high water of the morning reaches Woods Hole at 1:20 a.m. and Eastport at 3:58 a.m., more than two and a half hours apart. The fall ranges from 12.47 ft to 0.47 ft on the same morning. And the interval between an extreme and the next one is not a constant six hours and a bit: at Woods Hole the stored week holds 16 high waters and 15 low waters across seven days, with a mean range of 0.89 ft, while Eastport's mean range is 14.05 ft.
A station with a small vertical range is not therefore a quiet station. The height barely moves at Woods Hole; what the water is doing horizontally is a current question, answered by a current product, and nothing in the table above licenses a guess about it. That is the whole lesson of high tide vs slack tide compressed into one row.
What you can conclude from a tide table, and what you cannot
You can read these things straight off a tide prediction for the station named on the page:
- When the surface is expected to be at its highest and lowest, in local clock time.
- How high and low, in feet above MLLW, which combined with a chart sounding gives you an expected depth.
- How long you have between one extreme and the next, which is the number most shore plans actually depend on.
- Whether the range is growing or shrinking across the week, which tells you whether the extremes are heading toward spring or neap conditions.
You cannot read these, and should distrust any page that claims them from heights alone:
- When slack water occurs, or how long it lasts.
- Which way the current is running at a given moment, or how fast.
- Whether a bar, a channel or a flat is safe to cross, swim or anchor in.
- What the water will actually do on the day. NOAA is explicit that "we can only predict the astronomical tides" and "cannot predict the effect that wind, rain, freshwater runoff" have on the level. A gale can put the water feet above the line.
Getting the right numbers for your own spot
Three practical steps, in order of how much they matter.
First, pick the station, not the town. Predictions belong to the station they were computed for, and a subordinate station's values are derived by applying time and height offsets to a reference station — the station pages name which reference station, so you can see how far the derivation reaches. If your spot is up an estuary from the station you picked, expect the real timing to be later than the page says.
Second, check the datum and the time zone before you trust a time. Every page here states that heights are feet above MLLW and that predictions were requested with time_zone=lst_ldt, so NOAA applies daylight saving itself and the times are clock times at the station. A tide table with no datum and no time zone on it is not a table, it is a rumour.
Third, if your plan depends on the current rather than the height, go and get current predictions. They are a separate NOAA product with its own stations, and no amount of arithmetic on the heights above substitutes for them. If your plan depends on conditions, read the forecast.
For heights, the printable tide chart tool will pull any station and date range from NOAA and print it with the station, datum and fetch time on the page — which is the shortest version of everything in this guide. Keep the distinction behind high tide vs slack tide in mind and a tide table becomes a reliable tool for the questions it can answer, instead of a confident answer to a question it was never asked.
Sources, all retrieved 17 October 2026
- NOAA Tides and Currents FAQ — the definition of slack water, the statement that tide and current predictions are generated separately, that their timing relationship is not simple, and the limits of astronomical prediction.
- NOAA Tides and Currents glossary — high water, low water, flood current, ebb current and mean lower low water, quoted verbatim.
- NOAA National Ocean Service currents tutorial — tidal currents as the one predictable class of current.
- NOAA CO-OPS Data API documentation — the
predictionsproduct, thehilointerval, and the datum and time-zone parameters used on this site. - Heights and times in both tables and in the figure: NOAA CO-OPS tide predictions for the stations named, datum MLLW, retrieved 17 October 2026 and stored with this site. See the methodology page.
Frequently asked questions
Is slack tide the same as high tide?
No. High water is a height — NOAA defines it as the maximum height reached by a rising tide. Slack water is a condition of the current, a period when there is little or no horizontal motion of the water. They are different quantities, NOAA predicts them from different products, and the agency's own FAQ says the relationship between the times of high or low tide and the times of slack water is not a simple one.
How long does slack tide last?
There is no single answer, and no tide-height table can tell you. The duration depends on the station and the geometry of the channel it sits in, and it comes from tidal current predictions rather than tide predictions. TideCurve publishes tide heights only, so it does not state slack water durations for anywhere.
Does the tide stop moving at high water?
The surface height changes very slowly near an extreme, which is why the water looks still. In the stored sample for Portland, Maine, the surface fell about 0.10 ft in the first thirty minutes after high water and about 0.76 ft in the thirty minutes around mid-tide — roughly seven times as much. That is the height slowing down, not the current stopping.
Why do tide tables for two nearby places show different times?
Because a prediction belongs to the station it was computed for. Predictions travel up an estuary and around a headland with real delays, and a subordinate station's values are derived by applying time and height offsets to a reference station. Pick the station nearest your spot rather than the nearest town name.
What does a predicted height of 1.4 ft actually mean?
It means the surface is predicted to sit 1.4 ft above mean lower low water, the datum NOAA uses for US tide predictions. It is not the depth of water under a boat. Depth is whatever the chart shows for that spot plus the predicted height.
Can I use a tide chart to decide when it is safe to go out?
No. These are astronomical predictions, and NOAA states that it cannot predict the effect of wind, rain and freshwater runoff on the water level. A storm or a strong onshore wind can hold the water well above the predicted line. Use the marine forecast and observed water levels for conditions.