Spring Tide vs Neap Tide: The Twice-Monthly Range Cycle
Spring tide vs neap tide: why the tide range swells and shrinks twice a month, and what six months of NOAA predictions at Hampton Harbor show.
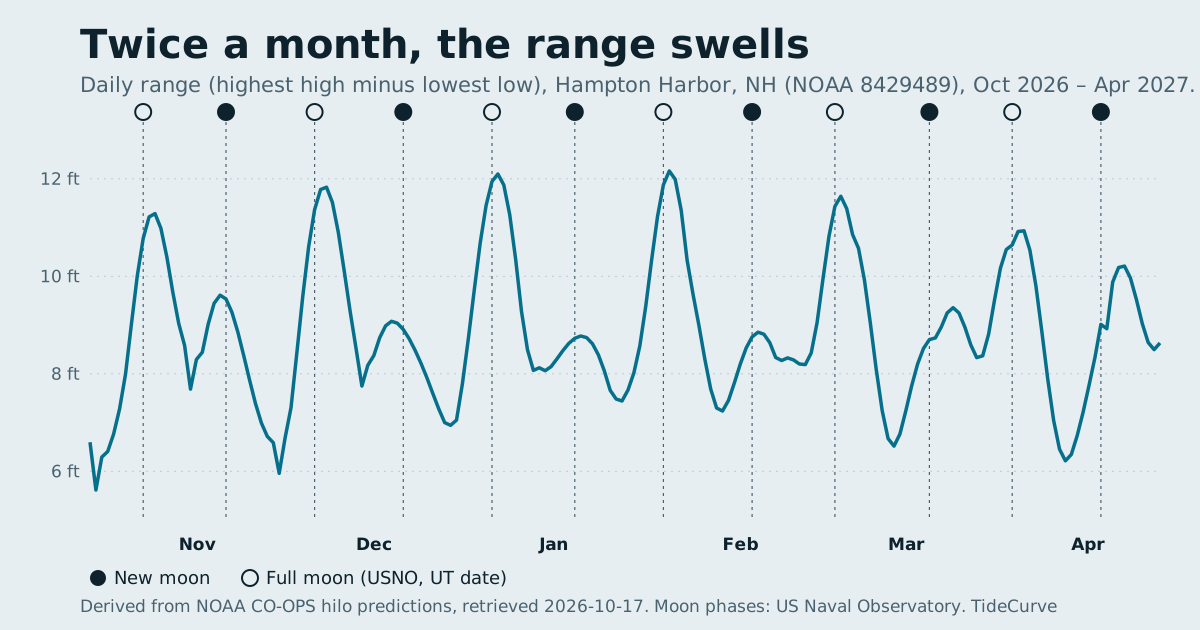
Spring tide vs neap tide is the twice-monthly swing in how far the tide rises and falls. Spring tides come around new and full moon, when the sun and moon pull in line and the range grows; neap tides come around the quarter moons, when they pull at right angles and the range shrinks. At Hampton Harbor, New Hampshire, NOAA's predictions for the next six months show the daily range swelling from about 6 ft at neaps to as much as 12.16 ft at springs, twice in every lunar month, in every month of the year.
This guide explains the mechanism in NOAA's terms, then reads the cycle straight off 182 days of stored NOAA predictions for Hampton Harbor, lined up against moon phases from the US Naval Observatory.
Spring tide vs neap tide, in NOAA's terms
NOAA's explainer on spring and neap tides gives the core of it. Spring tides happen at new and full moon, when the Earth, sun and moon are nearly aligned; the tidal range is slightly larger, so high tides are a little higher and low tides a little lower. Neap tides happen during the first and third quarter moons, when, in NOAA's words, "Neap tides, which also occur twice a month, happen when the sun and moon are at right angles to each other." The sun's pull then partly cancels the moon's, and the result is moderate tides: highs a little lower and lows a little higher than average.
Two things in that explanation trip people up.
The name has nothing to do with the season. NOAA states that "Spring tides occur twice each lunar month all year long without regard to the season." The word comes from the idea of the tide springing forth. There are spring tides in January and neap tides in May.
The sun is the smaller partner. NOAA's tutorial on what causes tides explains that although the sun is far more massive than the moon, it is about 390 times farther away, and tidal force falls off with the cube of distance. Net result: "the sun's tide-generating force is about half that of the moon." The moon sets the rhythm of the tide; the sun either reinforces it (springs) or works against it (neaps).
| Spring tide | Neap tide | |
|---|---|---|
| Moon phase | New and full moon | First and third quarter |
| Sun and moon | Nearly in line with the Earth | At right angles |
| Range | Larger than average | Smaller than average |
| High waters | A little higher | A little lower |
| Low waters | A little lower | A little higher |
| How often | Twice a lunar month | Twice a lunar month |
What the cycle looks like in six months of predictions
This site stores NOAA's high and low water predictions for Hampton Harbor, station 8429489, from 17 October 2026 to 16 April 2027: 352 high waters and 351 low waters. For each calendar day, the daily range below is the highest high water minus the lowest low water that day. The figure at the top of the page plots it for all 182 days, with new and full moons from the US Naval Observatory marked above.
The pattern is hard to miss. The line climbs to a peak, falls to a trough about a week later, climbs again, and repeats, two peaks per lunar month. Taking the largest daily range within four days of each new or full moon, and the smallest within four days of each quarter moon:
| Moon phase (USNO, UT date) | Day of largest or smallest range | Daily range | High water | Low water |
|---|---|---|---|---|
| Full moon, 26 Oct 2026 | 28 Oct | 11.29 ft | 10.19 ft | -1.096 ft |
| Last quarter, 1 Nov | 3 Nov | 7.69 ft | 8.641 ft | 0.955 ft |
| New moon, 9 Nov | 8 Nov | 9.61 ft | 9.301 ft | -0.31 ft |
| First quarter, 17 Nov | 18 Nov | 5.96 ft | 7.698 ft | 1.74 ft |
| Full moon, 24 Nov | 26 Nov | 11.83 ft | 10.456 ft | -1.37 ft |
| Last quarter, 1 Dec | 2 Dec | 7.75 ft | 8.474 ft | 0.726 ft |
| New moon, 9 Dec | 7 Dec | 9.08 ft | 8.991 ft | -0.085 ft |
| First quarter, 17 Dec | 17 Dec | 6.94 ft | 7.802 ft | 0.86 ft |
| Full moon, 24 Dec | 25 Dec | 12.10 ft | 10.546 ft | -1.551 ft |
| Full moon, 22 Jan 2027 | 23 Jan | 12.16 ft | 10.494 ft | -1.664 ft |
| Full moon, 20 Feb | 21 Feb | 11.64 ft | 10.201 ft | -1.439 ft |
| Last quarter, 30 Mar | 31 Mar | 6.21 ft | 7.565 ft | 1.351 ft |
The moon phase dates are in Universal Time from the USNO, which is four or five hours ahead of New England clock time, so a phase listed for early on a date can fall on the previous evening locally. The ranges are derived from NOAA's predicted heights in feet above mean lower low water.
Read across the rows and the textbook description holds up. Every spring row has a low water near or below zero and a high water near or above 9 ft; every neap row has a low water well above zero and a high water below 9 ft. The neap tide on 18 November moves the water only 5.96 ft in a day; the spring tide eight days later moves it 11.83 ft, almost twice as much.
The lag after the moon
The peaks do not land exactly on the moon phase. In the table above, the largest range in a spring run falls between two days before the phase and two days after it, and across all 23 phases in the six-month window the extreme falls between two days before and four days after. Most often it is one or two days after.
Neaps behave the same way. The smallest daily range near the first quarter moon of 17 November falls on 18 November, and the smallest near the last quarter of 30 March 2027 falls on 31 March. The trough is broad: on 17 and 19 November the daily range is 6.59 ft and 6.68 ft, within about 0.7 ft of the 5.96 ft on the 18th.
That lag is a property of the predicted tide at this station, and it is the reason to look at a tide table rather than a moon calendar. A moon phase tells you a spring tide is coming that week. The predicted heights tell you which day it peaks and how big it is.
Not all spring tides are equal
The second thing the six-month record shows is that the two spring tides in a month are not the same size. From late October 2026 to February 2027 at Hampton Harbor, the spring tides near full moon reach 11.29 ft to 12.16 ft of daily range, while the ones near new moon in the same months reach only 8.78 ft to 9.61 ft. The figure shows it plainly: tall peaks under the open circles, much smaller ones under the filled circles.
NOAA's tides tutorial on variations names one reason spring tides differ: the moon's distance changes over the month, and when the moon is closest to the Earth, at perigee, tidal ranges are larger than average, while at apogee, about two weeks later, they are smaller. This site has not fetched perigee dates, so it does not attribute any particular week's difference to perigee. The data simply shows that, over this six-month window, one spring tide in each month was markedly bigger than the other, and that the biggest of them all, 12.16 ft on 23 January 2027, came a day after a full moon.
When a spring tide and perigee coincide, the result is what NOAA's FAQ calls a perigean spring tide, the popular "king tide". The king tides guide covers those.
How spring and neap tides show up on a tide table
You do not need a chart of daily range to spot the cycle. A tide table shows it directly in three ways.
The size of the swing between consecutive numbers. On the neap day of 18 November, Hampton Harbor's predictions are a high of 7.413 ft, a low of 1.74 ft and a high of 7.698 ft. Eight days later, on 26 November: a low of -0.165 ft, a high of 10.456 ft and a low of -1.37 ft. The neap numbers bunch together in the middle; the spring numbers spread out to both ends.
Minus signs on the low waters. Negative low tides cluster in spring runs, because that is when lows fall lowest. The negative low tide guide counts them over a full year and shows them arriving in runs of several days.
The step from one day to the next. As a spring tide builds, each day's range is larger than the day before; as it fades, each is smaller. In the six days from 24 to 29 November at Hampton Harbor the daily range goes 11.37, 11.78, 11.83, 11.52, 10.90 and 10.11 ft: a peak, then a steady retreat toward the next neap.
The station pages on this site show the week as a curve, which makes the same thing visible at a glance: in a spring week the cyan and violet limbs grow taller each day; in a neap week they flatten.
Spring and neap tides along the coast
Every station on the coast goes through the same cycle on roughly the same days, because the sun and moon act on the whole coast at once. What changes from place to place is the size. From this site's stored predictions for 17 to 23 October 2026, the mean range between successive extremes is 14.05 ft at Eastport, 6.90 ft at Portland and 0.89 ft at Woods Hole. A spring tide at Eastport and a spring tide at Woods Hole are the same astronomical event producing very different water movements.
So "it's a spring tide this week" is a statement about the calendar. How much the water actually moves is a statement about the station, and only that station's predictions can answer it. The state hubs rank every station by range over the same week for exactly this reason.
What spring and neap tides do not tell you
A spring or neap label describes the predicted range of height. It is not a forecast of conditions. NOAA's Tides and Currents FAQ is clear that the predictions cover only the astronomical tide and that "We cannot predict the effect that wind, rain, freshwater runoff," and other short-term weather have on the water. A neap week with a strong onshore wind can put the water above a spring week's prediction.
Nor does the label say anything about currents, which NOAA predicts separately, or about whether any activity is advisable. TideCurve does not rate tides for fishing, swimming, boating or walking, and nothing on this page describes any tide as safe.
Finding the next spring tide at your station
Open your station from the full list of tide charts and look at the coming week's curve and tables. If the lows are dipping toward or below zero and the highs are climbing each day, a spring tide is building; if the numbers are bunching toward the middle, it is a neap. To see further ahead, the printable tide chart tool will pull any station and date range from NOAA, and sorting a month of rows by height shows the spring and neap days immediately.
Keep spring tide vs neap tide in mind as a calendar, and your station's predicted heights as the measurement, and the twice-monthly rhythm of the tide becomes something you can plan around a week ahead.
Sources, all retrieved 17 October 2026
- NOAA National Ocean Service, What are spring and neap tides?
- NOAA National Ocean Service, tides tutorial: what causes tides: the relative strength of the sun and moon.
- NOAA National Ocean Service, tides tutorial: variations: perigee, apogee, spring and neap tides.
- NOAA Tides and Currents FAQ: perigean spring tides and the limits of astronomical prediction.
- US Naval Observatory, Astronomical Applications API, moon phases from 3 October 2026 to 20 May 2027, Universal Time, stored with this site in
docs/data/moon-phases-usno.json. - NOAA CO-OPS hilo predictions for Hampton Harbor, NH, station 8429489, 17 October 2026 to 16 April 2027, feet above MLLW, and for Eastport, Portland and Woods Hole, 17 to 23 October 2026, stored with this site. Daily ranges, mean ranges and the moon-phase pairing are derived.
Frequently asked questions
What is the difference between a spring tide and a neap tide?
A spring tide has a larger than average range, with higher highs and lower lows, and happens around new and full moon when the sun, moon and Earth line up. A neap tide has a smaller range and happens around the first and third quarter moons, when the sun and moon pull at right angles. At Hampton Harbor the daily range in the stored predictions runs from 5.62 ft at its smallest to 12.16 ft at its largest.
Do spring tides only happen in spring?
No. NOAA says spring tides occur twice each lunar month all year long without regard to the season. The name comes from the idea of the tide springing forth, not from the time of year. The largest range in Hampton Harbor's stored predictions falls on 23 January 2027.
How often do spring and neap tides occur?
Each happens twice a lunar month, so roughly once a week one gives way to the other. NOAA puts a neap tide seven days after a spring tide. In Hampton Harbor's stored predictions, the peaks in daily range land within four days of every new and full moon from late October 2026 to April 2027.
Is the spring tide on the day of the full moon?
Usually within a day or two of it, not always on it. In Hampton Harbor's stored predictions, the largest daily range in each spring run fell between two days before and four days after the moon phase, most often one or two days after. The exact lag varies by station and is a property of the predictions, not something to assume.
Are all spring tides the same size?
No. In Hampton Harbor's stored predictions the spring tides near full moon from October 2026 to February 2027 reach 11.29 ft to 12.16 ft of daily range, while those near new moon in the same months reach only 8.78 ft to 9.61 ft. NOAA's tides tutorial notes that the moon's changing distance from the Earth also enlarges or reduces the range.
Does a neap tide mean calmer water?
It means a smaller predicted range of height and nothing more. Tide predictions are astronomical, they leave out wind, pressure and runoff, and they say nothing about currents or sea state. TideCurve does not describe any tide as calm or safe.