Negative Low Tide: What a Minus Tide Means in New England
A negative low tide is water below mean lower low water, not the sea floor. A year of NOAA data shows how often it happens from Maine to Nantucket.
A negative low tide is a low water that NOAA predicts will fall below the station's zero line, mean lower low water (MLLW). A reading of -1.2 ft means the surface should sit 1.2 ft under that long-term average, not 1.2 ft under the sea floor. On the New England coast it is not rare: at Portland, Maine, 196 of the 705 low waters predicted for the coming year are below zero, a little more than one in four.
This guide explains what the zero on a tide chart actually is, counts how often minus tides happen at seven NOAA stations from Eastport to Nantucket over the next twelve months, and shows why they arrive in runs rather than one at a time. Every number comes from NOAA CO-OPS high and low water predictions for 18 October 2026 to 17 October 2027, referenced to MLLW, in feet and local clock time, retrieved 17 October 2026.
What zero means on a tide chart
Zero on a NOAA tide chart is not the bottom, and it is not the lowest the water can go. It is an average. NOAA's datum definitions describe MLLW as the average of the lower low water height of each tidal day, taken over the National Tidal Datum Epoch. That epoch is NOAA's official 19-year averaging period, currently 1983 through 2001, and NOAA reviews it every 20 to 25 years because sea level moves.
Two consequences follow from that definition. First, because zero is an average of the lower lows, many individual lower lows land beneath it. A negative number is a low water on the low side of average, nothing more exotic than that. Second, because MLLW is also the reference NOAA uses for nautical charts, a charted depth and a predicted tide height are measured from the same line and can be added together. A spot charted at 5 ft with a predicted low of -1.0 ft would have about 4 ft of water over it at that moment, before any effect of wind or air pressure.
It helps to see where the other averages sit. Here are Portland's datums from NOAA's datum sheet for station 8418150, converted from the station's own reference to MLLW by subtracting NOAA's MLLW value:
| Datum | What it averages | Height above MLLW at Portland |
|---|---|---|
| MLLW | The lower of the two daily low waters | 0.00 ft |
| MLW | Every low water | 0.35 ft |
| MSL | Every hourly height | 4.94 ft |
| MHHW | The higher of the two daily high waters | 9.91 ft |
The gap between mean low water and mean lower low water is only 0.35 ft at Portland. That small gap is the reason both of a day's lows can dip below zero together, which, as the tables further down show, is exactly what happens during a spring-tide run.
One more distinction worth keeping straight: MLLW is a tidal datum, not a land elevation. Flood maps and surveys often use NAVD 88, a separate geodetic reference, and NOAA warns that NAVD 88 should not be treated as mean sea level. A negative tide height is only ever negative relative to MLLW at its own station.
How often negative low tides happen, station by station
The table below counts every predicted low water at seven NOAA stations across the coming year. These are counts of predictions, not observations, and each station is measured against its own MLLW.
| Station | Low waters in the year | Below 0 ft | Days with a minus tide | At or below -1.0 ft | Lowest predicted |
|---|---|---|---|---|---|
| Eastport, ME | 705 | 177 | 120 | 85 | -2.626 ft, 23 Jan 2027, 5:33 p.m. |
| Bar Harbor, ME | 705 | 185 | 137 | 53 | -1.886 ft, 23 Jan 2027, 5:20 p.m. |
| Portland, ME | 705 | 196 | 144 | 49 | -1.829 ft, 23 Jan 2027, 5:38 p.m. |
| Fort Point, NH | 705 | 190 | 139 | 46 | -1.746 ft, 23 Jan 2027, 5:44 p.m. |
| Boston, MA | 705 | 171 | 124 | 39 | -1.774 ft, 23 Jan 2027, 5:49 p.m. |
| Woods Hole, MA | 713 | 195 | 132 | 0 | -0.649 ft, 23 Jan 2027, 4:01 p.m. |
| Nantucket Island, MA | 706 | 173 | 142 | 0 | -0.633 ft, 23 Jan 2027, 6:32 p.m. |
Three things stand out.
Minus tides are routine everywhere on this list. Between 24.3% (Boston) and 27.8% (Portland) of predicted low waters fall below zero at every station, from Eastport to the islands south of Cape Cod. The share barely changes with the size of the tide, because each station's zero is built from that station's own lows.
How far below zero depends on the range. In the Gulf of Maine, where the tide range is large, a minus tide can go well past -1 ft. Eastport has 85 lows at or below -1.0 ft in the year, and its lowest prediction is -2.626 ft. Woods Hole and Nantucket, on the small-range coast south of the Cape, have none at all: their deepest predictions are -0.649 ft and -0.633 ft. A "big minus tide" in Portland and a big minus tide on Nantucket are different events, even when they fall on the same evening.
The deepest lows arrive together. Every station's lowest prediction of the year falls on the same date, 23 January 2027, between 4:01 p.m. at Woods Hole and 6:32 p.m. on Nantucket. The forces that raise and lower the tide act on the whole coast at once; the local basin decides only the timing and the size.
A practical reading of that last column: if you want the lowest water of the season at one of these stations, the late afternoon of 23 January 2027 is when NOAA expects it. Whether the water actually gets there depends on the weather that week, which no prediction includes.
Why minus tides come in runs
Negative lows do not scatter randomly through the month. They come in runs of several days, roughly twice a month. NOAA's explanation is the spring tide cycle described in its guide to spring and neap tides: around new and full moons the sun and moon line up, the tidal range grows, and low tides fall lower than average while high tides rise higher. NOAA is explicit that spring tides have nothing to do with the season. They happen in every month of the year.
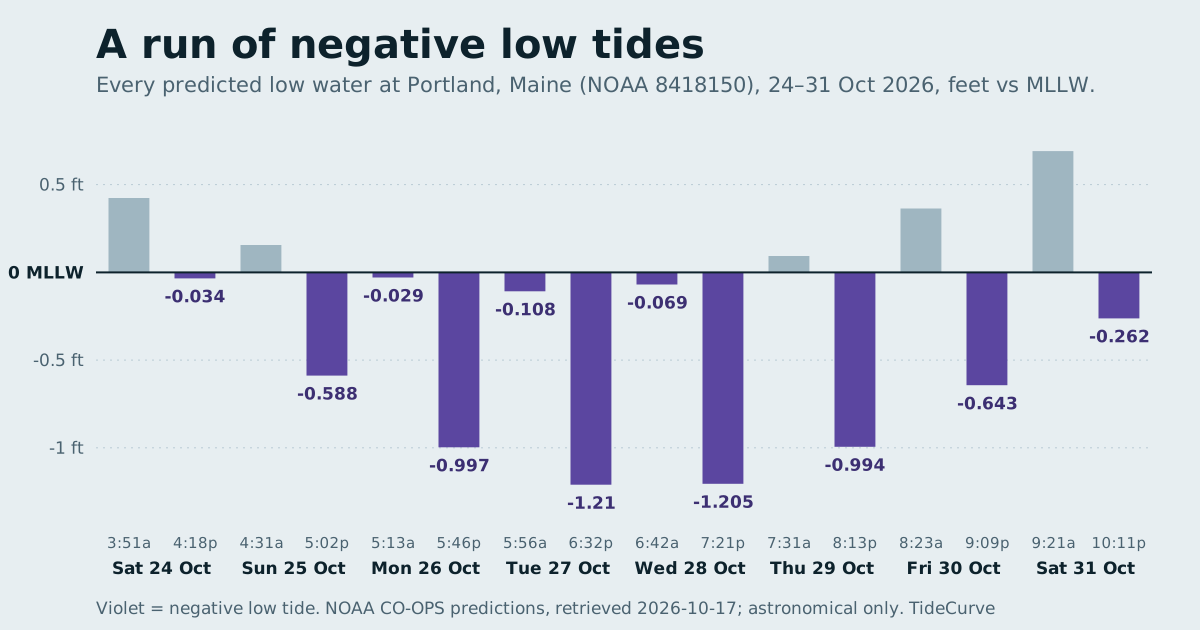
You can watch a run build at Portland in the coming week. These are every predicted low water from 24 to 31 October 2026, the same values drawn in the figure at the top of this page:
| Date | Morning low | Evening low |
|---|---|---|
| Sat 24 Oct | 3:51 a.m., 0.424 ft | 4:18 p.m., -0.034 ft |
| Sun 25 Oct | 4:31 a.m., 0.156 ft | 5:02 p.m., -0.588 ft |
| Mon 26 Oct | 5:13 a.m., -0.029 ft | 5:46 p.m., -0.997 ft |
| Tue 27 Oct | 5:56 a.m., -0.108 ft | 6:32 p.m., -1.21 ft |
| Wed 28 Oct | 6:42 a.m., -0.069 ft | 7:21 p.m., -1.205 ft |
| Thu 29 Oct | 7:31 a.m., 0.093 ft | 8:13 p.m., -0.994 ft |
| Fri 30 Oct | 8:23 a.m., 0.364 ft | 9:09 p.m., -0.643 ft |
| Sat 31 Oct | 9:21 a.m., 0.691 ft | 10:11 p.m., -0.262 ft |
The run starts just under zero on the evening of 24 October, bottoms out at -1.21 ft on the evening of 27 October, and fades back above zero by 1 November, when NOAA's two predicted lows are 0.972 ft and 0.048 ft. Notice that the evening low is the deep one every day, while the morning low hovers near zero. That uneven pair is the "lower low" in mean lower low water: on most days one of the two lows is lower than the other, and the datum is built from the lower one.
Notice too that each evening low comes later than the one before, by 44 minutes at the start of the week and by more than an hour at the end: 4:18 p.m. on 24 October, 10:11 p.m. on 31 October. A run that starts in the late afternoon drifts into the night by its end. So the -1.21 ft low on 27 October falls at 6:32 p.m., while the -0.643 ft low three days later falls at 9:09 p.m.
Negative low tides through the year at Portland
Runs repeat all year, but they are not equally frequent in every month. Counting Portland's negative lows by calendar month across the coming year:
| Month | Negative low waters at Portland |
|---|---|
| October 2026 (from the 18th) | 11 |
| November 2026 | 16 |
| December 2026 | 17 |
| January 2027 | 16 |
| February 2027 | 20 |
| March 2027 | 18 |
| April 2027 | 17 |
| May 2027 | 14 |
| June 2027 | 11 |
| July 2027 | 14 |
| August 2027 | 18 |
| September 2027 | 16 |
| October 2027 (to the 17th) | 8 |
Every full month has at least 11 negative lows, and February has the most at 20. There is no off-season for minus tides at Portland. What changes through the year is how deep they go and what time of day they fall, which is the next thing to check.
Why the timing matters more than the number
If you are heading out to look at tide pools, dig clams or photograph a ledge that is normally underwater, the time of a minus tide matters as much as its depth. This late in the year, the deep lows on the Gulf of Maine stations fall in the late afternoon and evening. In the Portland run above, the -1.21 ft low is at 6:32 p.m., and the lowest prediction of the whole year, -1.829 ft on 23 January 2027, is at 5:38 p.m.
Across the full year at Portland, 87 of the 196 negative lows fall between 7 a.m. and 6 p.m. clock time. The other 109 fall in the early morning or at night. The counts at the other stations are similar: 84 of 190 at Fort Point, 70 of 171 at Boston, 78 of 185 at Bar Harbor. At each of those four stations, fewer than half of the year's minus tides happen inside ordinary daytime hours. Check the clock column before the height column.
Two more limits worth keeping in mind:
- These are astronomical predictions. They leave out wind, air pressure and river runoff, so on the day the water can sit above or below the predicted low. A predicted -0.3 ft can fail to show up as a minus tide at all, and a predicted 0.2 ft can come in below zero.
- The water comes back on schedule. A minus tide is the bottom of the curve, so the water starts rising straight after it. For how quickly the height changes across a tide, see high tide vs slack tide, which measures one falling tide at Portland in half-hour steps.
Nothing on this page rates whether conditions suit any activity, and nothing here describes conditions as safe. Predicted heights cannot support that judgment.
Reading a minus number on a tide table
Most tide tables, including the station pages on this site, list four or so extremes a day with a height beside each. Three habits make the negative ones easier to read.
Read the sign before the size. A low of -0.034 ft and a low of 0.034 ft are practically the same water level; the minus sign only says which side of an average the prediction sits on. A low of -1.21 ft, on the other hand, is a real departure: at Portland that is about 1.2 ft lower than the long-term average of the daily lower lows.
Compare lows within one station, not across stations. Eastport's -2.626 ft and Nantucket's -0.633 ft are each measured from their own zero, and each zero is built from a very different tide. The useful comparison is how far a given low sits below that station's typical low water.
Look at the run, not the single day. A minus tide is easier to plan around once you can see the whole sequence: where it starts, which day is deepest, and how the timing drifts each evening. That is exactly what the curve on each station page is drawn to show.
Finding the next negative low tide near you
Open your nearest station from the full list of stations. Each page draws the coming week as a curve with NOAA's predicted low waters marked as dots, so a run of minus tides shows up as the low dots dipping under the zero line. Stations are named for the NOAA gauge, not for the nearest town, so pick the gauge closest to where you will actually be.
To look further ahead, the printable tide chart tool takes any station and date range and returns the high and low waters as a printable table or a CSV file. Sort the low waters in a spreadsheet and anything with a minus sign is a negative low tide; sort the time column and you can see at a glance which ones fall in daylight.
The counts on this page come from NOAA's Data API with interval=hilo, datum=MLLW and time_zone=lst_ldt, the same request style described on the methodology page.
Sources, all retrieved 17 October 2026
- NOAA CO-OPS, tidal datum options and definitions: MLLW, MLW, MSL, MHHW, the National Tidal Datum Epoch and NAVD 88.
- NOAA National Ocean Service, What are spring and neap tides?
- NOAA CO-OPS, datums for Portland, ME, station 8418150, epoch 1983–2001.
- NOAA CO-OPS Data API: high and low water predictions, MLLW, feet, local standard/daylight time, for stations 8410140, 8413320, 8418150, 8423898, 8443970, 8447930 and 8449130, 18 October 2026 through 17 October 2027.
Once you know the zero is an average of the daily lower lows, a negative low tide stops looking like an error and starts looking like a schedule.
Frequently asked questions
What does a negative low tide mean?
It means the low water is predicted to fall below mean lower low water, the zero on a NOAA tide chart. At -1.2 ft the surface should sit 1.2 ft below that long-term average of the daily lower lows. It says nothing about the sea floor.
Is a minus tide the same as a king tide?
Not exactly. NOAA notes that king tide is a popular name for a spring tide. Spring tides make high waters higher and low waters lower, so the deepest minus tides fall in spring-tide runs, but minus tide describes only the low end of the cycle.
How often are there negative low tides in Maine?
At Portland, 196 of the 705 low waters NOAA predicts between 18 October 2026 and 17 October 2027 fall below zero, on 144 separate days. Bar Harbor and Eastport have similar counts, but Eastport's go deeper.
Why are minus tides deeper in Maine than on Cape Cod?
The share of lows below zero is similar along the whole coast, but the depth follows the tide range. Eastport has 85 lows at or below -1.0 ft in the coming year. Woods Hole and Nantucket have none, and their lowest predictions are -0.649 ft and -0.633 ft.
Does a negative tide mean the water is below the sea floor?
No. Zero is a water level, not the bottom. NOAA charts measure depths from the same MLLW zero, so at a -1.0 ft low the water over a spot charted at 5 ft is about 4 ft, before any effect of wind or pressure.
Can the actual low tide be lower or higher than the prediction?
Yes. The predictions are astronomical and do not include wind, air pressure or river runoff, so the water on the day can sit above or below the predicted value. A small predicted minus tide may not appear at all.