Subordinate Tide Stations: How NOAA Derives Predictions
Subordinate tide stations borrow their predictions from a reference station, shifted in time and scaled in height. Thirteen New England examples.
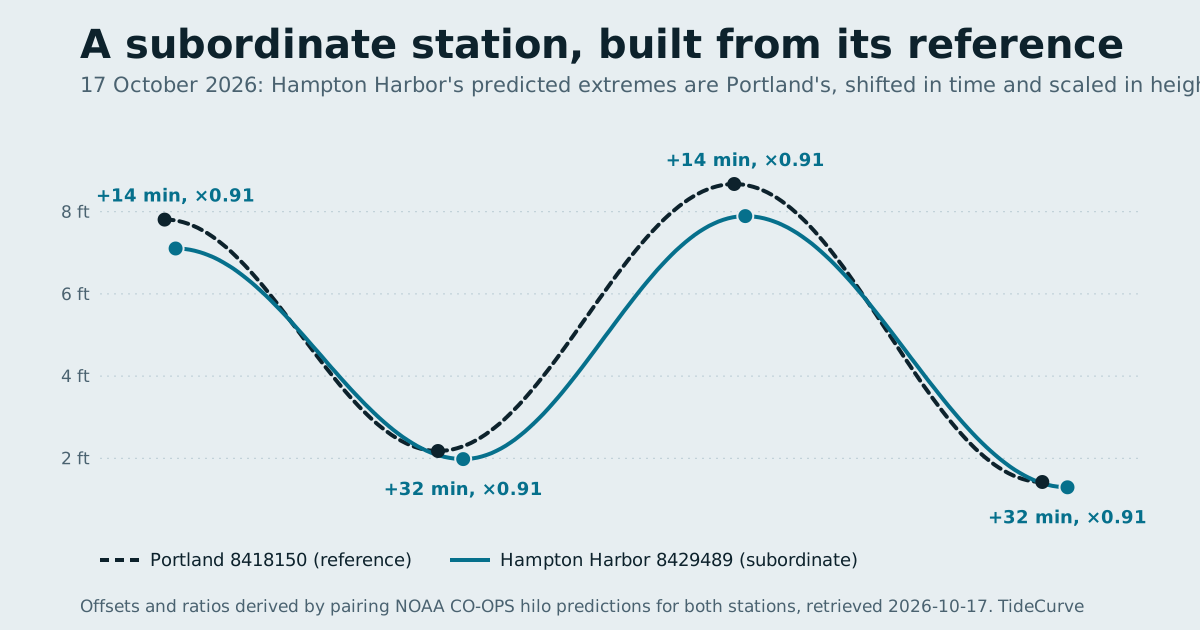
Subordinate tide stations are NOAA stations whose predictions are not computed from their own long record but borrowed from a nearby reference, or harmonic, station and adjusted: shifted earlier or later in time, and scaled up or down in height. Thirteen of the 31 New England stations on this site are subordinate. Hampton Harbor, New Hampshire, is one; in NOAA's stored predictions every high water there comes exactly 14 minutes after Portland's and every low water 32 minutes after, each at 0.91 times Portland's height.
This guide explains the two kinds of station, recovers the adjustments for all thirteen subordinate stations from the predictions stored with this site, and sets out what that means when you read one of their tide tables.
Harmonic stations: predictions from a station's own record
A harmonic station, which NOAA also calls a reference station, has observed the water long enough for its tide to be analysed into constituents. NOAA's page on harmonic constituents explains that there are 37 that "normally have the greatest effect on tides", that at least 30 days of data are used, and that "A year of data is necessary to directly observe all of the 37 tidal harmonic constituents." Once those constants are known, a prediction is a sum of cosine curves and can be run for any time.
NOAA's tide prediction user guide puts it simply: for harmonic stations, "Predictions for these stations are based solely on the analysis of that data." It adds that harmonic predictions "can be generated for any interval, and can be adjusted to different tidal datums." On NOAA's own map, "Harmonic stations are labeled with purple pins on the map interface."
Eight of this site's stations are listed by NOAA as reference stations: Eastport, Cutler, Bar Harbor, Bangor, Rockland, Fort Popham, Bath and Portland, all in Maine.
Subordinate tide stations: predictions by adjustment
A subordinate station is somewhere NOAA measured the tide for a shorter time. The user guide describes subordinate stations as "short-term historic stations" that "rely on nearby harmonic stations to generate predictions," using "adjustments based on the location of the subordinate station relative to the harmonic station."
Two consequences follow, and the guide states both:
- Only high and low waters. "Since this process generates predictions for high and low tides only, any interval between these tides is an approximation." The CO-OPS Data API documentation notes the same limit for the
hilointerval. - No choice of datum. The guide lists reference datum as an option for harmonic stations only.
| Harmonic (reference) station | Subordinate station | |
|---|---|---|
| Source of predictions | The station's own harmonic constants | A reference station's predictions, adjusted |
| Record needed | At least 30 days; a year to observe all 37 constituents | A shorter historical record |
| Prediction intervals | Any, including hourly and 6-minute | High and low waters only |
| Curve between extremes | Can be computed | An approximation |
| Datum options | Can be changed | Not offered |
| On NOAA's map | Purple pin | Other colour |
NOAA's Tides and Currents FAQ also refers to "the adjustments applied to generate predictions for subordinate stations from a designated harmonic station predictions" as one of the things its office can supply.
Recovering the adjustments from the predictions
NOAA's metadata, stored with this site, tags each station R (reference) or S (subordinate) and, for subordinate stations, names the reference station ID. That makes it possible to check the relationship directly. For each subordinate station, every predicted high and low water from 17 to 23 October 2026 was paired with the nearest extreme of the same type at its reference station, and two numbers were taken from each pair: the time difference, and the ratio of the heights.
The result is striking. For each station, the time difference is the same for every high water and the same for every low water, and the height ratio is fixed to within rounding. These are the derived values:
| Subordinate station | Reference station | Distance | High water: time, height ratio | Low water: time, height ratio |
|---|---|---|---|---|
| Hampton Harbor, NH | Portland 8418150 | 60 mi | +14 min, 0.91 | +32 min, 0.91 |
| Jaffrey Point, NH | Portland 8418150 | 48 mi | -3 min, 0.95 | -5 min, 0.95 |
| South Freeport, ME | Portland 8418150 | 13 mi | +12 min, 0.99 | +10 min, 0.99 |
| Boothbay Harbor, ME | Portland 8418150 | 33 mi | -6 min, 0.97 | -8 min, 0.97 |
| New Harbor, ME | Portland 8418150 | 40 mi | -10 min, 0.97 | -8 min, 0.97 |
| Monhegan Island, ME | Portland 8418150 | 47 mi | -13 min, 0.97 | -9 min, 0.97 |
| Prospect Harbor, ME | Portland 8418150 | 121 mi | -24 min, 1.15 | -15 min, 1.15 |
| Southwest Harbor, ME | Bar Harbor 8413320 | 10 mi | 0 min, 0.96 | -27 min, 0.95 |
| Bass Harbor, ME | Bar Harbor 8413320 | 13 mi | +4 min, 0.93 | -27 min, 0.93 |
| Stonington, ME | Bar Harbor 8413320 | 28 mi | +8 min, 0.91 | +6 min, 0.90 |
| Castine, ME | Bar Harbor 8413320 | 29 mi | +15 min, 0.95 | +11 min, 1.00 |
| Belfast, ME | Bar Harbor 8413320 | 40 mi | +9 min, 0.97 | +4 min, 1.03 |
| Vinalhaven, ME | Bar Harbor 8413320 | 40 mi | +9 min, 0.87 | +10 min, 0.88 |
Times are subordinate minus reference; a positive number means the subordinate station's tide comes later. Ratios are subordinate height divided by reference height, rounded to two places. Distances are straight-line miles between the two stations' published coordinates. None of these are NOAA-published figures; they are recovered from NOAA's own predictions and labelled as derived.
As a check, Hampton Harbor's 174 high and low waters that overlap Portland's stored predictions, from 17 October to 30 November, were each compared with 0.91 times the matching Portland height. The largest difference is 0.0008 ft. The same check for Jaffrey Point at 0.95 also gives a largest difference of 0.0008 ft. Within the stored data, the relationship holds exactly.
What the offsets mean in practice
Low water at Hampton Harbor is later than the high-water shift suggests. Its highs trail Portland by 14 minutes, its lows by 32. On 17 October 2026, Portland's lows are at 10:09 a.m. and 10:56 p.m.; Hampton Harbor's are at 10:41 a.m. and 11:28 p.m. If you read Portland's table and added a single offset, you would be off at one end of the tide or the other.
Subordinate stations do not have their own spring and neap rhythm. Because each is a fixed transformation of its reference, every feature of the reference's tide carries over unchanged in shape: the same spring tides, the same lunar-day drift, the same pattern of days with three extremes. The spring and neap tides guide uses Hampton Harbor's six months of predictions; that cycle is Portland's, scaled.
Some subordinate tides are bigger than their reference. Prospect Harbor's heights are 1.15 times Portland's, and Belfast's low waters 1.03 times Bar Harbor's. A subordinate label says how the prediction is made, not that the tide is smaller.
A ratio on a low water is not the same as a ratio on the range. Scaling a low of 2 ft by 0.91 lowers it by 0.18 ft; scaling a high of 8 ft by 0.91 lowers it by 0.72 ft. And a negative low scaled by 0.91 becomes slightly less negative. Those consequences come from how the adjustment works, not from anything happening in the water.
A worked example on a spring tide day
The offsets are easiest to see on a big tide. On Thursday 26 November 2026, Portland's predictions include a high water of 11.49 ft at 11:37 a.m. and a low water of -1.506 ft at 6:06 p.m. Apply Hampton Harbor's adjustments by hand:
| Portland (reference) | Adjustment | Result | Hampton Harbor as NOAA predicts it | |
|---|---|---|---|---|
| High water time | 11:37 a.m. | +14 min | 11:51 a.m. | 11:51 a.m. |
| High water height | 11.49 ft | × 0.91 | 10.456 ft | 10.456 ft |
| Low water time | 6:06 p.m. | +32 min | 6:38 p.m. | 6:38 p.m. |
| Low water height | -1.506 ft | × 0.91 | -1.370 ft | -1.37 ft |
The hand calculation reproduces NOAA's Hampton Harbor values to the last digit NOAA prints. That is the whole subordinate method in four rows: nothing about Hampton Harbor's tide on that day is computed independently of Portland's.
Two things in that example are worth holding on to. The high water at Hampton Harbor is about a foot lower than Portland's, which matters if you are comparing heights between the two pages. And the evening low is about 0.14 ft less negative, because a ratio below one pulls negative numbers toward zero as well as positive numbers toward it. A reader expecting the Hampton Harbor minus tide to match Portland's would be off by that much before any weather is considered.
Stations whose type is not stated
Not every station on this site carries a prediction type. Ten of the 31, including Boston, Woods Hole, Nantucket Island, Chatham, Fort Point and Wells, came from NOAA's water-level station records rather than the tide-prediction listing, and those records do not include the R or S field. Their station pages say the type is not recorded in the metadata the station came from, rather than guess. Being in the water-level listing does mean NOAA lists a water level station at that ID, which is the kind of place where observed data can exist. Their predictions are still NOAA's own, requested in exactly the same way; what is missing is only the label. The methodology page explains why the station listing was assembled that way.
Reference stations are not interchangeable either
The subordinate structure can give a false sense that a whole coast runs on one clock. It does not. Comparing the reference stations themselves on 17 October 2026, from the predictions stored with this site, the first high water of the day is 3:51 a.m. at Bangor, 3:55 a.m. at Bar Harbor, 3:58 a.m. at Eastport, 4:22 a.m. at Portland and 5:03 a.m. at Bath. The mean range over 17 to 23 October runs from 14.05 ft at Eastport to 5.51 ft at Bath. Each reference station carries its own constituents for a reason.
The state hubs rank every station by range over the same week, and each station page lists its nearest neighbours with distances.
How to use a subordinate station's tide table
- Use it if it is the nearest station to you. The adjustments exist because the tide there was measured to differ from the reference: Hampton Harbor's lows come 32 minutes after Portland's, which a reader using Portland's table would miss. A prediction for your own harbour, subordinate or not, is a better starting point than one for a harbour 40 miles away.
- Read only the high and low waters as NOAA values. The curve drawn between them on any site, including this one, is an approximation. NOAA says so, and the methodology page on this site says so.
- Do not expect a live gauge. A subordinate station is a short-term historic site; there may be no current observations to check the prediction against. The prediction vs actual water level guide explains why that comparison matters.
- Check the reference station when something looks odd. Every TideCurve station page names its prediction type and reference station ID, so you can open both side by side.
For any station, the printable tide chart tool prints the NOAA request it used; for a subordinate station it will only offer high and low waters, because that is all NOAA provides.
Read that way, subordinate tide stations are not second-class predictions; they are a reference station's tide, carried to your harbour by two published adjustments.
Sources, all retrieved 17 October 2026
- NOAA CO-OPS, Tide Predictions User Guide: harmonic and subordinate stations, prediction intervals and datum options.
- NOAA CO-OPS, What are harmonic constituents?
- NOAA CO-OPS Data API documentation: the hilo interval.
- NOAA Tides and Currents FAQ: subordinate station adjustments.
- NOAA CO-OPS Metadata API station records (prediction type R or S, reference station ID, coordinates), stored with this site in
src/_data/stations.json, retrieved 16 October 2026. - NOAA CO-OPS hilo predictions for all 13 subordinate stations and their reference stations, 17 to 23 October 2026, and for Hampton Harbor, Jaffrey Point and Portland to 30 November 2026, feet above MLLW, stored with this site. Time offsets, height ratios, distances and ranges are derived.
Frequently asked questions
What is a subordinate tide station?
A station whose tide predictions are derived from a nearby harmonic (reference) station rather than computed from its own long record. NOAA's tide prediction user guide describes subordinate stations as short-term historic stations that rely on nearby harmonic stations to generate predictions, by applying adjustments based on the subordinate station's location relative to the harmonic station.
What is the difference between a harmonic station and a subordinate station?
A harmonic station's predictions are, in NOAA's words, based solely on the analysis of that station's own data, using its harmonic constants. A subordinate station's predictions are the harmonic station's predictions adjusted for time and height. Harmonic stations can give predictions at any interval; subordinate stations give high and low waters only.
Are subordinate station predictions less accurate?
NOAA does not publish a single accuracy comparison, and TideCurve has not measured one. What is certain is structural: a subordinate station inherits everything in its reference station's prediction, adjusted by fixed offsets, and NOAA says any interval between its high and low tides is an approximation. Where a subordinate station sits far from or in a very different setting to its reference, treat its numbers with more caution.
Why can't I get hourly predictions for some stations?
Because they are subordinate. NOAA's guide says the subordinate process generates predictions for high and low tides only, and the CO-OPS API notes that subordinate stations can only use the hilo interval. This site's printable tool lists that among its assumptions.
How do I know whether a station is subordinate?
On NOAA's prediction map, harmonic stations are marked with purple pins. Every TideCurve station page also states the prediction type from NOAA's metadata and, for subordinate stations, names the reference station ID the predictions are derived from.