How to Read a Tide Chart: Times, Heights and the Curve
How to read a tide chart, step by step: station, datum, clock, the four daily extremes, and what the curve between them does and does not show.
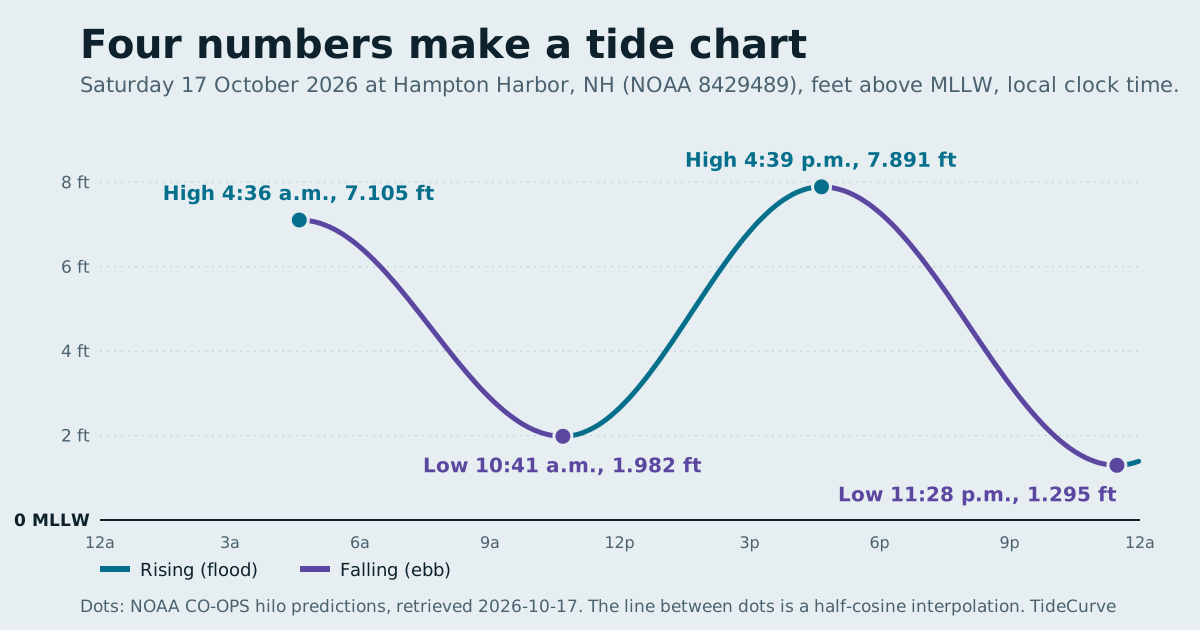
How to read a tide chart comes down to five things: confirm the station, confirm the zero the heights are measured from, confirm the clock, read the high and low waters as times and heights, and treat the curve between them as a drawing. A US tide chart lists each predicted high and low water as a clock time and a height in feet above mean lower low water. At Hampton Harbor, New Hampshire, on 17 October 2026, that is four lines: high 4:36 a.m. at 7.105 ft, low 10:41 a.m. at 1.982 ft, high 4:39 p.m. at 7.891 ft, and low 11:28 p.m. at 1.295 ft.
This guide walks through each step using that one day, then shows what changes across a week, and finishes with the things a tide chart cannot tell you.
Step 1: check which station the chart is for
Every tide prediction belongs to one NOAA station, a specific point on the coast with a seven-digit ID. Hampton Harbor's is 8429489. Predictions do not transfer cleanly from one station to the next; the time and size of the tide change along a coast and up every estuary.
Station names can mislead. The nearest station to a town is not always named after that town, and some stations are subordinate: their predictions are derived from a nearby reference station rather than computed from their own long record. NOAA's tide prediction user guide describes subordinate stations as "short-term historic stations" that "rely on nearby harmonic stations to generate predictions." Hampton Harbor is one; its reference is Portland, Maine. The subordinate stations guide explains what that means for the numbers.
Pick the station closest to where you will actually be, on the same side of any headland and at the same point in any river. The list of tide charts on this site names each station by its NOAA name and ID.
Step 2: check the datum, the chart's zero
Heights on a tide chart are not depths. They are distances above a reference level called a datum. NOAA's user guide says its prediction pages show heights "in feet relative to mean lower low water (MLLW)" by default, and nearly every US tide chart does the same.
MLLW is the long-term average of the lower of each day's two low waters. So:
- A positive height means the water is predicted above that average.
- Zero means it is predicted exactly at it.
- A negative height means it is predicted below it, which happens routinely around spring tides.
On the Hampton Harbor day, every height is positive: the lowest of the day is 1.295 ft. The MLLW guide shows where the other averages sit above that zero and how to add a predicted height to a charted depth.
Step 3: check the clock
A tide time is only as good as its time zone. The NOAA Data API offers three: GMT; lst, "Local Standard Time, not corrected for Daylight Saving Time"; and lst_ldt, local standard time "corrected for Daylight Saving Time when appropriate." The API documentation lists all three.
TideCurve requests lst_ldt, so every time on this site is ordinary clock time at the station, with daylight saving already applied. Daylight saving ended at 2 a.m. on 1 November 2026, according to NIST, and the predictions shift by an hour that morning to match the clocks. A chart printed in standard time would be an hour early all summer.
Step 4: read the high and low waters
Now the numbers themselves. For Hampton Harbor on Saturday 17 October 2026:
| Tide | Time | Height, ft above MLLW | Change from the previous extreme |
|---|---|---|---|
| High | 4:36 a.m. | 7.105 | |
| Low | 10:41 a.m. | 1.982 | falls 5.12 ft in 6 h 05 min |
| High | 4:39 p.m. | 7.891 | rises 5.91 ft in 5 h 58 min |
| Low | 11:28 p.m. | 1.295 | falls 6.60 ft in 6 h 49 min |
Read it as a story. The day starts near high water. The tide falls through the morning, bottoms out just before 11 a.m., floods back through the afternoon to a slightly higher high, then ebbs to the lowest point of the day just before midnight.
Three details are worth noticing even on one day:
The two highs are not equal, and neither are the two lows. The afternoon high is 0.79 ft above the morning one; the late-evening low is 0.69 ft below the morning one. That difference between a day's two highs or two lows is normal on this coast, and it is the reason MLLW is built from the lower of the two lows.
The intervals are not a fixed six hours. They run from 5 h 58 min to 6 h 49 min on this one day. A rule of thumb that the tide turns every six hours will be off by most of an hour.
The range changes from one tide to the next. The three swings are 5.12, 5.91 and 6.60 ft. They grow through the day because a spring tide is building toward late October; the spring and neap tides guide follows that cycle over six months.
Step 5: read the curve as a drawing
Most tide charts join the extremes with a smooth line. It is useful, and it is also the part that is not data.
NOAA's high-and-low product gives only the extremes. For a subordinate station like Hampton Harbor, the user guide is explicit: "Since this process generates predictions for high and low tides only, any interval between these tides is an approximation." On this site the line between two dots is a half-cosine curve, the standard sinusoidal approximation of a tide, and the methodology page says so.
Read that way, the curve tells you two honest things.
Direction. On the chart above, the line is cyan while the water is rising and violet while it is falling. At any moment you can see whether the next extreme is a high or a low.
Shape. A tide moves slowly near high and low water and fastest midway between them. Splitting the 6 h 05 min falling tide on the morning of 17 October into six equal parts, the half-cosine curve drops about 0.35 ft in the first sixth, 0.94 ft in the second and 1.28 ft in each of the middle two, then 0.93 ft and 0.35 ft again at the end. Roughly half the fall happens in the middle third of the tide. That is the shape behind the old "rule of twelfths", and it is a property of the approximation, not a NOAA measurement.
If you need the predicted height at a particular moment, the curve gives an estimate. On that same falling tide it passes 4 ft at about 8:04 a.m. and is back above 4 ft on the rising tide at about 1:04 p.m. Those are interpolated times, labelled as such. NOAA can provide true six-minute predictions at harmonic stations, but not at subordinate ones.
Reading a whole week
One day shows the parts; a week shows the pattern. Here is how Hampton Harbor's predictions move from 17 to 23 October 2026:
| Date | First high | Lowest low of the day | Highest high of the day |
|---|---|---|---|
| Sat 17 Oct | 4:36 a.m. | 1.295 ft | 7.891 ft |
| Sun 18 Oct | 5:31 a.m. | 2.122 ft | 7.737 ft |
| Mon 19 Oct | 6:27 a.m. | 1.413 ft | 7.704 ft |
| Tue 20 Oct | 7:23 a.m. | 1.388 ft | 7.794 ft |
| Wed 21 Oct | 8:14 a.m. | 1.23 ft | 7.992 ft |
| Thu 22 Oct | 9:00 a.m. | 0.974 ft | 8.256 ft |
| Fri 23 Oct | 9:41 a.m. | 0.544 ft | 8.532 ft |
Two patterns stand out. The tide arrives later each day, by 41 to 56 minutes for the first high of the morning: 4:36, 5:31, 6:27, 7:23, 8:14, 9:00, 9:41. The tide times guide explains why. The range widens through the week, with the lows falling from about 1.3 ft toward 0.5 ft and the highs climbing past 8.5 ft, as the tide builds toward the spring run at the end of the month.
Sunday 18 October also shows a quirk that confuses many readers: it has only three extremes, a high, a low and a high. Its second low water falls at 12:24 a.m. on Monday. Because the tides slip later each day, every couple of weeks one extreme drops past midnight. In Hampton Harbor's 182 stored days, 25 have three extremes and 157 have four. Nothing is missing; the tide has simply crossed the date line on the clock.
The same day on four different charts
Reading one chart well is half the skill. The other half is not carrying its numbers to a different station. Here is 17 October 2026 at Hampton Harbor and three other stations on the same coast, every value as NOAA predicted it:
| Station | Morning high | Morning low | Afternoon high | Evening low |
|---|---|---|---|---|
| Eastport, ME | 3:58 a.m., 16.024 ft | 10:10 a.m., 3.557 ft | 4:16 p.m., 16.858 ft | 10:42 p.m., 2.595 ft |
| Portland, ME | 4:22 a.m., 7.808 ft | 10:09 a.m., 2.178 ft | 4:25 p.m., 8.672 ft | 10:56 p.m., 1.424 ft |
| Hampton Harbor, NH | 4:36 a.m., 7.105 ft | 10:41 a.m., 1.982 ft | 4:39 p.m., 7.891 ft | 11:28 p.m., 1.295 ft |
| Boston, MA | 4:31 a.m., 8.145 ft | 10:24 a.m., 2.364 ft | 4:37 p.m., 9.099 ft | 11:07 p.m., 1.588 ft |
Each row reads exactly as Step 4 describes, but the rows are not interchangeable. Eastport's afternoon high is more than twice Hampton Harbor's, because each is measured from its own MLLW at the bottom of a very different tide. Hampton Harbor's evening low comes 32 minutes after Portland's. And at Woods Hole, on the same date, the first high of the day is at 1:20 a.m. and the day's whole spread of predicted heights is only 1.13 ft, from 0.698 ft to 1.83 ft. The chart format is identical; the tide it describes is not.
That is why Step 1 comes first. Every other step assumes the station is the right one, and a correct reading of the wrong station's chart is still a wrong answer.
What a tide chart does not tell you
A tide chart answers when and how high the astronomical tide is predicted to be. It does not answer several questions people often bring to it.
- What the water will actually do. NOAA's FAQ says plainly that "We cannot predict the effect that wind, rain, freshwater runoff," and similar short-term events have on the tide. The prediction vs actual water level guide compares a week of NOAA's verified record at Portland with the prediction.
- Which way the water is flowing, or how fast. Currents are a separate NOAA product with separate stations. The high tide vs slack tide guide covers why heights cannot stand in for currents.
- Whether anything is safe. A predicted height says nothing about footing, surf, cold water, channels or weather. TideCurve does not rate any tide for any activity.
Putting it together
When you open any tide chart, run the same short check before using a number: which station, which datum, which clock, then the times and heights, then the curve as an approximation between them. Every station page on this site prints all three of the first items above the table, and the printable tide chart tool prints them on every page it produces.
That is how to read a tide chart without being caught out: the four numbers a day are NOAA's, and everything else on the page is there to help you read them.
Sources, all retrieved 17 October 2026
- NOAA CO-OPS, Tide Predictions User Guide: harmonic and subordinate stations, the default MLLW datum, and the approximation between extremes.
- NOAA CO-OPS Data API documentation: the hilo interval and the gmt, lst and lst_ldt time zones.
- NIST, daylight saving time: the 2026 end date.
- NOAA Tides and Currents FAQ: the limits of astronomical prediction.
- NOAA CO-OPS hilo predictions for Hampton Harbor, NH, station 8429489, 17 October 2026 to 16 April 2027, feet above MLLW,
time_zone=lst_ldt, stored with this site. Intervals, ranges, counts and interpolated heights are derived; interpolation uses the half-cosine method described on the methodology page.
Frequently asked questions
What do the numbers on a tide chart mean?
Each row is one predicted high or low water: a clock time and a height. The height is in feet above the station's mean lower low water (MLLW), the zero for US tide charts, not the depth of the water. On 17 October 2026 at Hampton Harbor, for example, the chart lists a high of 7.105 ft at 4:36 a.m. and a low of 1.982 ft at 10:41 a.m.
Why are there sometimes only three tides in a day?
Because a full tidal cycle runs a little longer than a calendar day. NOAA gives the lunar day as 24 hours and 50 minutes, so the tides slip about an hour later each day and every couple of weeks one extreme drops past midnight into the next day. In Hampton Harbor's 182 stored days, 25 days have three extremes and 157 have four.
What does a negative number on a tide chart mean?
The low water is predicted to fall below mean lower low water, the zero. That is common and normal; zero is an average of the daily lower lows, so many individual lows fall under it. It does not mean the sea floor is exposed by that amount.
How do I find the tide height between high and low tide?
A high-and-low table does not give it; it lists only the extremes. Charts draw a smooth line between them, usually a sinusoidal approximation, and on this site it is a half-cosine curve labelled as interpolated. On the falling tide at Hampton Harbor on the morning of 17 October 2026, that curve passes 4 ft at about 8:04 a.m., but the NOAA values are only the two endpoints.
Is the time on a tide chart in daylight saving time?
It depends on the chart. TideCurve requests NOAA predictions with time_zone=lst_ldt, which NOAA describes as local standard time corrected for daylight saving when appropriate, so every time shown is the clock time at the station. A chart in standard time will be an hour off in summer.
Can a tide chart tell me if it is safe to walk out or launch?
No. A tide chart gives predicted astronomical heights and times only; wind, air pressure and runoff can move the water well away from them, and the chart says nothing about currents or footing. TideCurve does not describe any tide as safe.