Tide Prediction vs Actual Water Level: Why They Differ
Tide prediction vs actual water level at Portland, Maine: a week of NOAA verified data against the forecast, and why the two never match exactly.
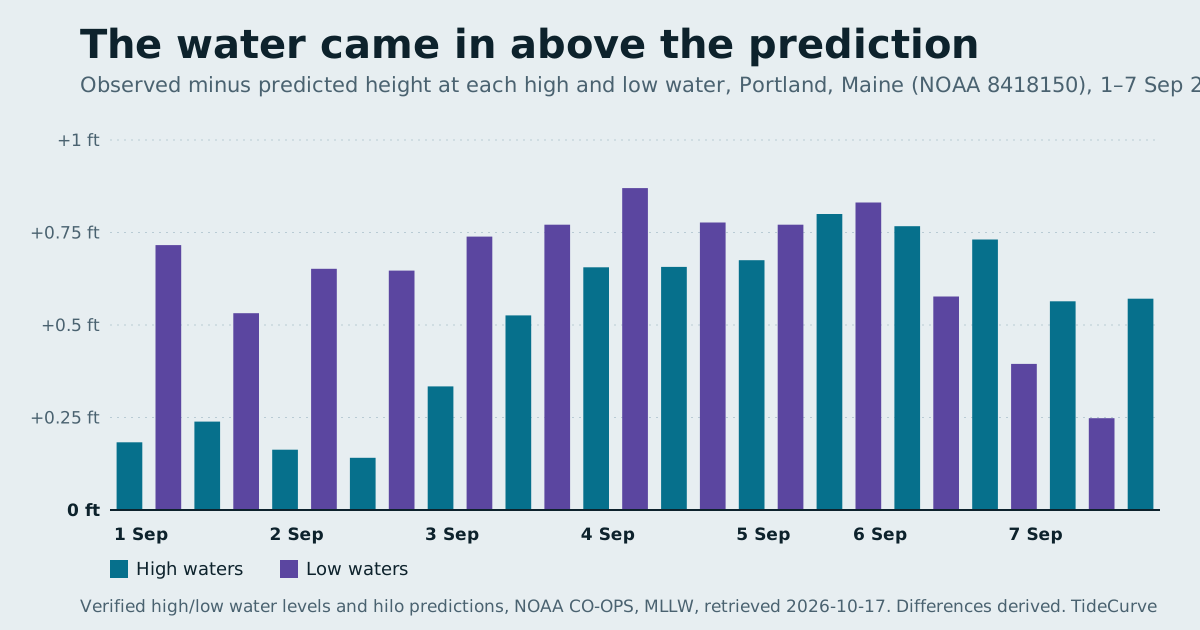
Tide prediction vs actual water level is the gap between what NOAA computes from astronomy and what a water level gauge records on the day. The prediction contains only the tide raised by the moon and sun; the actual level also carries wind, air pressure, river flow and longer-term changes in the sea surface. At Portland, Maine, in the first week of September 2026, NOAA's verified record put every one of 27 high and low waters above the prediction, by 0.14 ft to 0.87 ft, while the times stayed within about a quarter of an hour.
This guide explains where the two numbers come from, compares them side by side for that week using NOAA's own verified data, and sets out what the gap means for anyone reading a tide table, including the tables on this site.
Two different NOAA products
The heights on every TideCurve station page are predictions. The CO-OPS Data API documentation describes the predictions product simply as "Water level / tide prediction data for the station", and the hilo interval as tide predictions for high tide and low tide times and heights. Those numbers exist years ahead. They are computed, not measured.
The actual water level is a separate set of products from the same API:
| Product | What NOAA says it is | When it exists |
|---|---|---|
predictions |
Water level / tide prediction data for the station | Any date, past or future |
water_level |
Preliminary or verified 6-minute interval water levels, depending on data availability | Only after the fact, and only at stations with a gauge |
hourly_height |
Verified hourly height water level data | After verification |
high_low |
Verified high tide / low tide water level data | After verification |
Two details in that table matter for the comparison below. First, observed data only exists where there is an instrument. NOAA's National Water Level Observation Network is, in the words of its network page, "a network of 210 long-term, continuously operating water level stations throughout the US and its territories." Many of the places you can get a tide prediction for are not among them. Second, the documentation states that "Data is verified on a monthly basis for the past month", so the cleanest comparison uses a period that has already passed through that process.
How NOAA builds the prediction
A tide prediction is arithmetic on a set of cycles. NOAA's page on harmonic constituents explains that each constituent is a mathematical value describing one cyclical motion of the Earth, moon and sun, and that "There are 37 which normally have the greatest effect on tides". The prediction itself is described plainly: "Tide predictions are a calculation, adding the effects of each of the 37 cosine curves, to produce the complex curve that is the predicted tides."
The amplitudes and timings of those curves are fitted to a station's own observed record. The same page says a minimum of 30 days of data is used, and that "A year of data is necessary to directly observe all of the 37 tidal harmonic constituents." Once the constants exist, the prediction can be run for any date, which is why a page like this one can show heights for next spring.
What the method cannot do is know about anything that is not a regular astronomical cycle. NOAA's tide prediction user guide is direct about it: "Tide Predictions provide the times and heights for the astronomical tides." It adds that the predictions "do not include other influences that can alter coastal water level heights, like storm surge or sea level rise."
Tide prediction vs actual water level at Portland, one week
To see the size of the gap at a real station, this site requested both products from NOAA for Portland, Maine (station 8418150) for 1 to 7 September 2026: the hilo predictions and the verified high_low record, both in feet above mean lower low water and local clock time. The two lists have the same 27 extremes in the same order, so each observed high or low can be paired with the predicted one it corresponds to. The figure at the top of the page plots the height difference for every pair.
| Date | Predicted | Observed | Time difference | Height difference |
|---|---|---|---|---|
| 1 Sep, high | 2:12 a.m., 9.694 ft | 2:18 a.m., 9.877 ft | 6 min late | +0.183 ft |
| 1 Sep, low | 8:18 a.m., 0.077 ft | 8:18 a.m., 0.793 ft | on time | +0.716 ft |
| 1 Sep, high | 2:30 p.m., 10.193 ft | 2:30 p.m., 10.432 ft | on time | +0.239 ft |
| 1 Sep, low | 8:48 p.m., -0.13 ft | 8:54 p.m., 0.402 ft | 6 min late | +0.532 ft |
| 3 Sep, high | 4:07 p.m., 10.109 ft | 4:12 p.m., 10.635 ft | 5 min late | +0.526 ft |
| 4 Sep, low | 10:47 a.m., 0.897 ft | 10:48 a.m., 1.767 ft | 1 min late | +0.870 ft |
| 5 Sep, high | 6:12 p.m., 9.891 ft | 6:24 p.m., 10.691 ft | 12 min late | +0.800 ft |
| 6 Sep, low | 12:46 a.m., 0.411 ft | 12:36 a.m., 1.242 ft | 10 min early | +0.831 ft |
| 7 Sep, low | 2:08 p.m., 0.978 ft | 2:00 p.m., 1.226 ft | 8 min early | +0.248 ft |
| 7 Sep, high | 8:32 p.m., 10.153 ft | 8:36 p.m., 10.724 ft | 4 min late | +0.571 ft |
That is ten of the 27 pairs; the full set is stored with this site in docs/data/tide-prediction-vs-observed.json, with both NOAA requests written out. Across all 27:
- Every observed height was above the prediction. The smallest difference was +0.141 ft (the afternoon high on 2 September) and the largest +0.870 ft (the morning low on 4 September). The average was +0.58 ft.
- Low waters missed by more than high waters. The 13 lows averaged +0.66 ft; the 14 highs averaged +0.50 ft.
- The timing held up far better than the height. Observed extremes landed between 10 minutes early and 14 minutes late. Nineteen of the 27 were within 6 minutes of the prediction, and 26 within 12 minutes.
- Two predicted minus tides did not happen. NOAA predicted -0.13 ft on the evening of 1 September and -0.028 ft on the evening of 2 September. The verified lows were 0.402 ft and 0.619 ft. A reader who planned around a negative low tide that week would have found the water roughly half a foot higher than the table promised.
What the data does not say is why. The comparison establishes that the water sat above the astronomical prediction for the whole week; it cannot separate wind from pressure from anything else, and this site does not hold the weather record that would be needed to try. The honest reading is the one NOAA itself gives: the prediction is the astronomical part of the water level, and the rest is not in it.
What pushes the water away from the prediction
NOAA's Tides and Currents FAQ names the main causes in one sentence: "We cannot predict the effect that wind, rain, freshwater runoff," and other short-term meteorological events have on the tides. Its tides tutorial on other effects fills in the direction of each:
- Onshore wind piles water against the coast. The tutorial says onshore winds "may act to pile up water onto the shoreline, virtually eliminating low tide exposures."
- Offshore wind does the reverse: "Strong offshore winds can move water away from coastlines, exaggerating low tide exposures."
- High air pressure lowers the surface. In NOAA's words, "High – pressure systems can depress sea levels, leading to clear sunny days with exceptionally low tides." Low pressure works the other way.
- River flow matters most in estuaries, where "powerful seasonal river flows in the spring can severely alter or mask the incoming tide."
- Storms combine all of it. NOAA's storm surge explainer defines storm surge as "the rise in seawater level caused solely by a storm" and storm tide as "the observed seawater level during a storm, resulting from both storm surge and the tide."
There is also a slow component. Tide predictions are referenced to datums averaged over the National Tidal Datum Epoch, which NOAA's datum page gives as 1983 through 2001, and NOAA reconsiders that epoch every 20 to 25 years because of "periodic and apparent secular trends in sea level." The user guide lists sea level rise among the influences the predictions leave out. Whether any of the September offset at Portland comes from that, rather than from the weather that week, is not something a single week of data can show.
Where the gap is likely to be largest
NOAA does not publish one accuracy figure for all stations, and the FAQ explains why. "In general, predictions for stations along the outer coast are more accurate than those for stations farther inland," it says, and "Inland stations tend to have a stronger non-tidal influence." Shallow water and a small tidal range make it worse: "Stations in relatively shallow water, or with a small tidal range, are also highly susceptible to meteorological effects," and "At these stations, short-term weather events can completely mask the astronomical tides." Two examples are given: winds along Chesapeake Bay that "have been known to cause water levels to be 1-2 feet" away from predictions at Baltimore, and Galveston, Texas, where "it is possible for meteorological events to delay or accelerate the arrival of the predicted tides by an hour or more."
The size of the tide matters when you read a difference like Portland's. Half a foot is a modest share of a tide that swings by more than ten feet. The same half foot at a station with a small range is a large share of the whole tide. From this site's own stored predictions for 17 to 23 October 2026, the mean range between successive extremes is 14.05 ft at Eastport, 6.90 ft at Portland, 2.29 ft at Nantucket Island and 0.89 ft at Woods Hole. At Woods Hole, an offset the size of Portland's September average would be roughly two thirds of a typical tide. That is a ratio worked out from the stored numbers, not a measurement at Woods Hole, but it is the reason NOAA singles out small-range stations as the hardest to predict.
Reading a tide table when the two disagree
None of this makes predictions useless. It defines what they are good for.
Times are the robust part. In the Portland week, the clock time of high and low water held to within a quarter of an hour while the heights drifted by up to 0.87 ft. If your plan depends mostly on when the tide turns, the prediction is the right tool, with NOAA's caveat that weather can shift timing by an hour or more at difficult stations.
Heights near a threshold deserve a margin. If the number you care about is close to some level you have in mind, such as a predicted minus tide only a few hundredths below zero, the prediction alone cannot tell you which side of it the water will land on. Two such lows simply did not appear at Portland in September.
The prediction does not describe conditions. Every page on this site repeats the same limit: the heights are astronomical, wind, pressure and runoff are not in them, and nothing here describes conditions as safe. For the day itself, read the marine forecast and the observed level from a NOAA gauge, where one exists.
Check whether your station has a gauge. A subordinate station's prediction is derived from a nearby harmonic station; the user guide describes subordinate stations as "short-term historic stations" that "rely on nearby harmonic stations to generate predictions." There is no live record to compare against at such a place. The station pages on this site state whether each station is a reference station or a subordinate one, and which reference station it is tied to.
Checking a prediction against the record yourself
The comparison in this guide can be repeated for any NOAA water level station and any past week. Request the predictions product with interval=hilo, and the high_low product for the same dates, station, datum and time zone; then pair the rows in order. Keep three things identical across both requests or the comparison is meaningless:
- The datum. Both requests here use MLLW. Mixing datums shifts every row by a fixed amount.
- The time zone. Both use
lst_ldt, local time with daylight saving applied. - The window. Use dates already verified; NOAA verifies monthly for the past month.
The methodology page lists the exact request format this site uses, and the printable tide chart tool prints the prediction request it made on the page, so you can see precisely what was asked of NOAA. For background on the zero the heights are measured from, see negative low tide, and for why the water seems to stop near high water, high tide vs slack tide.
Sources, all retrieved 17 October 2026
- NOAA CO-OPS Data API documentation: the
predictions,water_level,hourly_heightandhigh_lowproducts, monthly verification, datum and time-zone parameters. - NOAA CO-OPS Data API responses for Portland, ME, station 8418150, 1 to 7 September 2026:
predictionswithinterval=hilo, and verifiedhigh_low, datum MLLW,time_zone=lst_ldt. Both requests and every row are stored indocs/data/tide-prediction-vs-observed.json. - NOAA Tides and Currents FAQ: limits of astronomical prediction, outer-coast versus inland accuracy, the Baltimore and Galveston examples.
- NOAA, What are harmonic constituents?: the 37 constituents and the data lengths used to derive them.
- NOAA CO-OPS, Tide Predictions User Guide: what predictions include and exclude, and subordinate stations.
- NOAA National Ocean Service, tides tutorial: other effects: wind, pressure and river flow.
- NOAA National Ocean Service, storm surge and storm tide.
- NOAA CO-OPS, National Water Level Observation Network.
- NOAA CO-OPS, tidal datum definitions: the National Tidal Datum Epoch.
- Mean ranges for Eastport, Portland, Nantucket Island and Woods Hole: derived from NOAA hilo predictions stored with this site for 17 to 23 October 2026.
Keep the distinction behind tide prediction vs actual water level in view and a tide table becomes what it really is: a reliable clock for the astronomical tide, with the weather still to be added.
Frequently asked questions
Why is the actual tide higher than predicted?
A tide prediction contains only the astronomical tide. NOAA states that it cannot predict the effect of wind, rain, freshwater runoff and other short-term weather on the water level, so anything that pushes water toward the coast or raises the sea surface shows up as a difference. In the week of 1 to 7 September 2026 at Portland, Maine, every verified high and low water came in above the prediction, by 0.14 ft to 0.87 ft.
How accurate are NOAA tide predictions?
It depends on the station. NOAA says predictions for stations on the outer coast are generally more accurate than those for stations farther up rivers, bays and estuaries, and that shallow-water and small-range stations are hardest. In the Portland week examined here, the timing of 26 of 27 extremes landed within 12 minutes of the prediction, while the heights were consistently high by about half a foot.
Where can I see the actual water level instead of the prediction?
NOAA publishes observed water levels for its water level stations through the same CO-OPS Data API that serves predictions, as the water_level product (preliminary or verified six-minute data) and the high_low product (verified high and low waters). Not every prediction station has a sensor; subordinate stations are short-term historic stations whose predictions are derived from a nearby harmonic station.
Does a tide prediction include storm surge?
No. NOAA defines storm surge as the rise in seawater level caused solely by a storm, and its tide prediction guide says the predictions do not include storm surge or sea level rise. The level actually reached during a storm, which NOAA calls the storm tide, is the surge added to the astronomical tide.
Can the actual tide come earlier or later than predicted?
Yes. NOAA notes that at some stations meteorological events can delay or accelerate the arrival of the predicted tide by an hour or more, citing Galveston, Texas. At Portland in the September week examined here, the observed extremes landed between 10 minutes early and 14 minutes late.