What Is MLLW? Tidal Datums on a Tide Chart Explained
What is MLLW? The zero on US tide charts, how MHHW, MHW, MSL and MLW stack above it, and how to read heights and depths with Portland's NOAA datums.
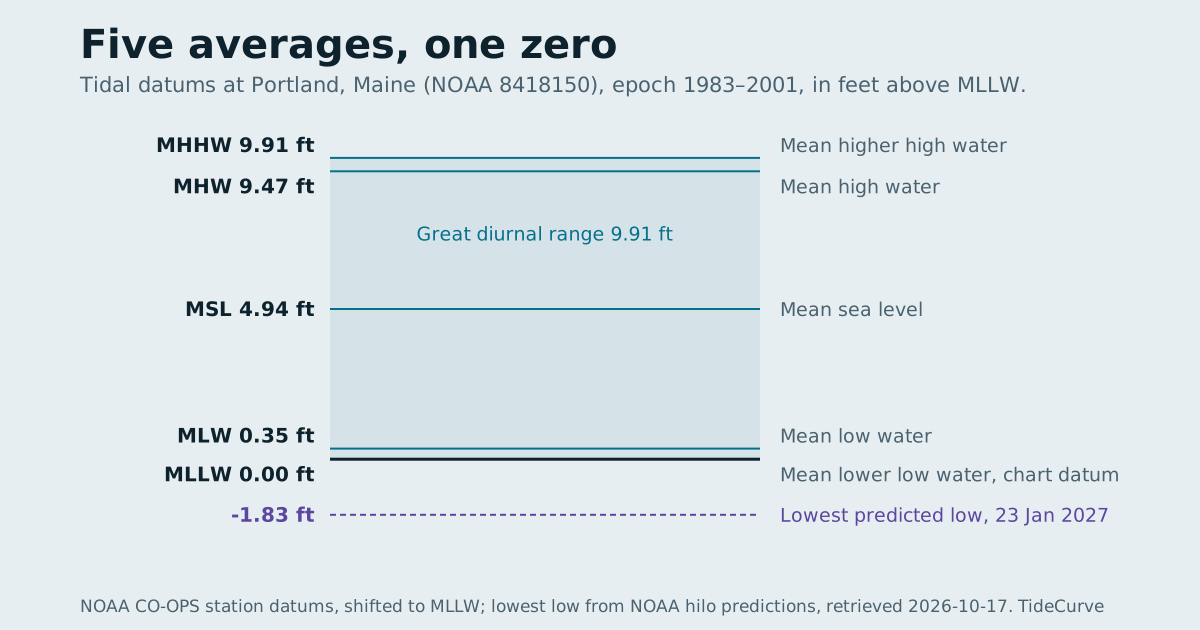
What is MLLW? It is mean lower low water, the zero that every NOAA tide prediction and every US nautical chart depth is measured from: the long-term average of the lower of each day's two low waters at one particular station. A tide height of 2.5 ft means the water is predicted to sit 2.5 ft above that average, not 2.5 ft deep. At Portland, Maine, the other common averages stack above it at 0.35 ft (mean low water), 4.94 ft (mean sea level), 9.47 ft (mean high water) and 9.91 ft (mean higher high water).
This guide explains what each tidal datum averages, why US tide charts chose the lowest of them as zero, and how to use the datum ladder to read a tide table and a nautical chart together. Every station value comes from NOAA's datum sheet for Portland; every prediction comes from the NOAA predictions stored with this site.
What is MLLW, in NOAA's words
NOAA's tidal datum definitions define mean lower low water as "The average of the lower low water height of each tidal day observed over the National Tidal Datum Epoch." Three parts of that sentence do the work.
Lower low water. Most of the New England coast has two high waters and two low waters in a tidal day, and the two are rarely equal. The lower of the two lows is the lower low water. MLLW averages only those.
Each tidal day. A tidal day follows the moon, not the clock. NOAA's tutorial on the lunar day gives its length as 24 hours and 50 minutes, so one lower low per tidal day is slightly fewer than one per calendar day.
The National Tidal Datum Epoch. The same NOAA page describes the epoch as "The specific 19-year period adopted by the National Ocean Service as the official time segment" for computing datums, and gives the present one as 1983 through 2001. Nineteen years is long enough to include the slowest regular cycles in the tide, so the average does not depend on which years happened to be measured.
The result is a local, fixed, published height. It is computed for each station from that station's record, and it does not move with the weather or the season.
The tidal datums, from top to bottom
MLLW is one of a family. NOAA publishes the full set for each station, all derived from the same epoch:
| Datum | NOAA definition, shortened | At Portland, ft above MLLW |
|---|---|---|
| MHHW, mean higher high water | Average of the higher high water of each tidal day | 9.91 |
| MHW, mean high water | Average of all high water heights | 9.47 |
| MTL, mean tide level | Arithmetic mean of MHW and MLW | not used here |
| MSL, mean sea level | Arithmetic mean of hourly heights | 4.94 |
| MLW, mean low water | Average of all low water heights | 0.35 |
| MLLW, mean lower low water | Average of the lower low water of each tidal day | 0.00 |
The Portland values come from NOAA's datum sheet for station 8418150, epoch 1983 to 2001, published in feet above the station's own fixed reference and converted here by subtracting the MLLW value (8.55 ft) from each. The conversion is stored with this site alongside the negative low tide guide, which uses the same sheet.
NOAA also names two ranges built from these averages. The great diurnal range is "The difference in height between mean higher high water and mean lower low water", 9.91 ft at Portland. The mean range of tide is "The difference in height between mean high water and mean low water", 9.12 ft at Portland. Both are derived here from the datums in the table, not quoted from a separate NOAA figure.
Why the zero is the lowest average
There is a practical reason US tide tables measure from the bottom of the ladder rather than the middle. The CO-OPS Data API documentation describes the MLLW option as "Mean Lower Low Water (Nautical Chart Datum for all U.S. coastal waters)". Charted depths are measured down from MLLW, and predicted tide heights are measured up from it. Because they share a zero, they add:
| Charted depth at a spot | Predicted tide height | Expected water over the spot, before weather |
|---|---|---|
| 6 ft | +2.5 ft | 8.5 ft |
| 6 ft | 0.0 ft | 6 ft |
| 6 ft | -1.21 ft | 4.79 ft |
The last row uses Portland's predicted low of -1.21 ft on the evening of 27 October 2026. Those are arithmetic examples of how the two numbers combine, not a statement about any real spot, and the predicted height leaves out wind, air pressure and river flow. The point is the structure: because MLLW is a low average, most predicted heights are positive and the arithmetic usually adds water to the chart rather than taking it away.
If tide tables were referenced to mean sea level instead, almost every low water at Portland would be printed as a negative number near -4 or -5 ft, and charted depths would have to be shifted by the same amount to match.
Reading a tide table against the datum ladder
Laying a station's predictions against its datums tells you more about a given week than the heights alone. This site stores Portland's predictions from 17 October to 30 November 2026, 87 high waters and 87 low waters. Comparing them with the ladder:
- 39 of the 87 high waters are above MHW (9.47 ft), and 22 are above MHHW (9.91 ft). Highs that clear MHHW mark the larger tides of the month; the king tides guide follows those 22.
- 40 of the 87 low waters are below MLW (0.35 ft), and 27 are below MLLW, the zero.
- The highest prediction is 11.49 ft, on 26 November. The lowest is -1.509 ft, on 25 November. Both fall in the same few days, which is typical of a spring tide run.
There is also a useful sanity check in the same numbers. Averaging the higher of each day's highs across those 45 days gives 9.85 ft, close to Portland's MHHW of 9.91 ft. Averaging the lower of each day's lows gives 0.13 ft, a little above its MLLW of zero. A six-week window will not reproduce a 19-year average exactly, but it should land near it, and it does.
The practical reading: a high water marked 10.5 ft at Portland is about 0.6 ft above the station's average higher high, and a low water marked -0.5 ft is half a foot below its average lower low. The datum turns a bare number into a statement about how unusual that tide is for that place.
MLLW is local: comparing stations
Because every station's MLLW is computed from its own record, a zero at one station is a different surface from a zero at another. That is easy to forget when two tide tables sit side by side.
From the predictions stored with this site for 17 to 23 October 2026, the mean range between successive extremes is 14.05 ft at Eastport, 6.90 ft at Portland, 7.09 ft at Boston and 0.89 ft at Woods Hole. Each of those stations has its own MLLW at the bottom of its own range. A low of -1.0 ft at Eastport is a modest departure from a very large tide; a low of -0.5 ft at Woods Hole is a large one for a tide that small. The negative low tide guide shows the same pattern over a full year.
So the right comparison is always within a station: how far is this prediction from this station's own datums?
MLLW, NAVD 88 and land elevations
Tidal datums describe the water. Land elevations on flood maps, surveys and property records usually use a geodetic datum instead, most often NAVD 88, which NOAA describes as "A fixed reference for elevations determined by geodetic leveling." NOAA adds a warning on the same page: "NAVD 88 should not be used as Mean Sea Level."
The two systems are related at each tide station by a measured offset, but the offset differs from station to station. A number in feet above MLLW and a number in feet NAVD 88 cannot be compared until both are on the same reference, using that station's published conversion. This site does not convert tide predictions to land elevations, and it does not say whether any height of water reaches any piece of ground.
When the zero moves
MLLW is fixed for an epoch, not forever. NOAA's datum page says the epoch is needed because of "periodic and apparent secular trends in sea level," and that it is "actively considered for revision every 20-25 years." When a new epoch is adopted, every datum at a station is recomputed, MLLW included, and predictions against it shift accordingly.
Two consequences for a reader. First, a tide height is only fully specified when you know its datum and its epoch; every station page on this site names the datum and the methodology page names the request. Second, old printed tables and new online ones can differ slightly for the same date simply because their zeros differ.
Four common misreadings of the zero
Most confusion about tide heights comes from treating MLLW as something it is not. Four versions turn up again and again.
"Zero is the lowest the tide goes." It is an average of the lower lows, so by construction a large share of individual lower lows fall beneath it. At Portland, 27 of the 87 low waters predicted for 17 October to 30 November 2026 are negative, and the deepest of them is -1.509 ft on 25 November. A minus sign on a tide table is routine, not an error.
"Zero is the sea floor." The bottom has its own depth, shown on a chart, and it differs at every point. MLLW is a water level. A predicted 0.0 ft says where the surface will be, not how much water is under it; you need the charted depth for that.
"Zero is sea level." Mean sea level is a separate datum, 4.94 ft above MLLW at Portland. Calling the zero on a tide chart "sea level" understates every predicted high by about five feet at that station, and by a different amount everywhere else.
"The same height means the same water everywhere." A height is a distance above a local average. Portland's MHHW of 9.91 ft and a smaller-range station's MHHW are not the same surface, which is why a predicted 9 ft high is ordinary at Portland and far outside anything stored for Woods Hole, where the mean range in the stored October week is 0.89 ft. The comparison that means something is a height against its own station's datums.
Each of those mistakes disappears once the zero is understood as a local, long-term average of one particular kind of low water, which is exactly what NOAA's definition says.
Checking the datum on any tide page
Before trusting a height from any source, look for three things: the station it belongs to, the datum it is measured from, and the time zone of the clock. NOAA's own prediction user guide says its pages show heights "in feet relative to mean lower low water (MLLW)" by default, and that the reference datum can be changed at harmonic stations only.
The printable tide chart tool on this site prints the station, the datum and the exact NOAA request on every table it produces, so the zero is never in doubt. Once you know what is MLLW and where the other averages sit above it, every number on a tide chart becomes a distance from a known line rather than a bare figure.
Sources, all retrieved 17 October 2026
- NOAA CO-OPS, tidal datum options and definitions: MHHW, MHW, MTL, MSL, MLW, MLLW, the great diurnal range, the mean range, NAVD 88 and the National Tidal Datum Epoch.
- NOAA CO-OPS Data API documentation: MLLW as the nautical chart datum for US coastal waters, and the datum options.
- NOAA National Ocean Service, tides tutorial: the lunar day.
- NOAA CO-OPS, Tide Predictions User Guide: default datum and datum options.
- NOAA CO-OPS datum sheet for Portland, ME, station 8418150, epoch 1983 to 2001, stored with this site in
docs/data/negative-low-tide.json. - Predicted highs and lows for Portland, 17 October to 30 November 2026, and mean ranges for Eastport, Portland, Boston and Woods Hole, 17 to 23 October 2026: NOAA CO-OPS hilo predictions, MLLW, stored with this site. Counts and averages derived.
What is MLLW, in one line: the average of the daily lower lows at your station, and the zero that lets a tide table and a chart be read together.
Frequently asked questions
What does MLLW stand for?
Mean lower low water. NOAA defines it as the average of the lower low water height of each tidal day observed over the National Tidal Datum Epoch, which is currently 1983 through 2001. It is the zero that US tide predictions and nautical chart depths are both measured from.
Why do tide charts use MLLW instead of mean sea level?
Because MLLW is the chart datum. NOAA's API lists MLLW as the nautical chart datum for all US coastal waters, so a predicted tide height can be added straight to a charted depth. Mean sea level sits far above it; at Portland, Maine, MSL is 4.94 ft above MLLW, so a table referenced to MSL would show most low waters as large negative numbers.
What is the difference between MLW and MLLW?
MLW averages every low water; MLLW averages only the lower of the two low waters in each tidal day. On a coast with two unequal lows a day, MLLW is lower. At Portland the gap is 0.35 ft. In the stored predictions for 17 October to 30 November 2026, 40 of Portland's 87 low waters fall below MLW and 27 fall below MLLW.
Is MLLW the same at every station?
No. Each station's datums are computed from that station's own water level record, so MLLW is a local surface. A height of 2 ft above MLLW at Eastport and at Nantucket are not the same elevation, and neither is directly comparable to a land survey in NAVD 88 without the station's own conversion.
What does a tide height of 0.0 ft mean?
It means the water is predicted to sit exactly at the station's mean lower low water. It is not the sea floor and not the lowest the water ever goes; it is a long-term average of the daily lower lows, so lows below it happen routinely. At Portland, 27 of 87 predicted low waters between 17 October and 30 November 2026 are below zero.
Does NOAA ever change MLLW?
Yes. Datums are averaged over a fixed 19-year National Tidal Datum Epoch, and NOAA says the epoch is actively considered for revision every 20 to 25 years because of trends in sea level. When it changes, the zero moves and published heights are recomputed against the new one.