King Tides Explained: When the Highest Tides Arrive
King tides explained: what NOAA means by a perigean spring tide, how often they occur, and when Portland's predicted highs clear MHHW this autumn.
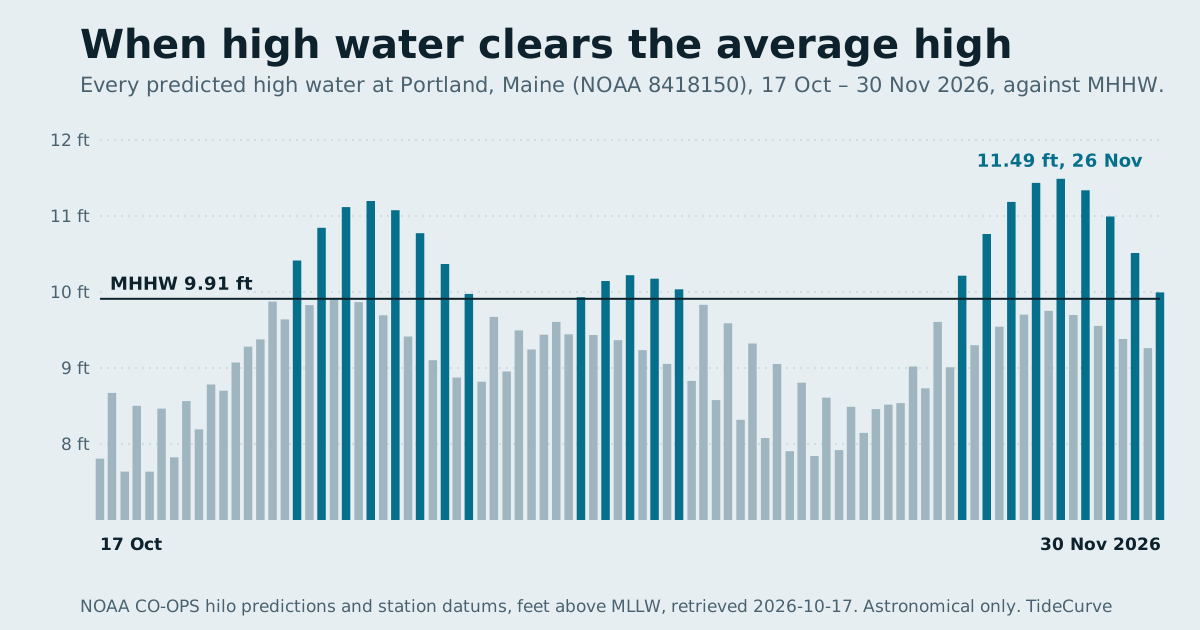
King tides explained in one line: they are the highest predicted tides of the year, which NOAA ties to the perigean spring tide, when a new or full moon lines up with the moon's closest approach to the Earth. NOAA says that coincidence happens between 6 and 8 times a year. On the Maine coast this autumn, NOAA's predictions put Portland's highest high waters at 11.49 ft on 26 November and 11.435 ft on 25 November, about 1.5 ft above the station's average higher high water.
This guide explains what the term means and does not mean, uses six weeks of stored NOAA predictions to show where the year's big highs cluster, and sets out what the predictions can and cannot say about flooding.
King tides explained by NOAA
The phrase is popular rather than technical. NOAA's own explainer, What is a king tide?, opens with "A King Tide is a non-scientific term people often use to describe exceptionally high tides." It notes that higher than normal tides typically occur during a new or full moon and when the moon is at its perigee.
The Tides and Currents FAQ gives the technical version under the heading of perigean spring tides:
- Spring tides happen twice a month, at new and full moon, and have a larger than average range.
- "Between 6 and 8 times per year, the New Moon/Full Moon (spring tides) coincide with the Moon being at perigee," its closest point to the Earth.
- "Popular media often refers to these as "King Tides"."
- The effect depends on location and range, but "It is not uncommon for high tides during a perigean spring tide to be more than a foot higher than" high tides during apogean spring tides, when the moon is farthest away.
- "During Perigean Spring Tides, tide heights can exceed 0.5 feet or more above the average daily highest tide height", that is, above mean higher high water.
So a king tide is not a different kind of tide. It is a spring tide, which happens every two weeks, that happens to land when the moon is near its closest. The spring and neap tides guide covers the twice-monthly cycle underneath it.
Why the moon's distance matters
The size of a tide depends steeply on distance. NOAA's tutorial on what causes tides states that "Tidal generating forces vary inversely as the cube of the distance from the tide generating object." A modest change in the moon's distance therefore makes a noticeable change in the tide.
The tides tutorial on variations describes the monthly effect: once a month, when the moon is closest to the Earth, at perigee, tidal ranges are larger than average; about two weeks later, at apogee, they are smaller. When perigee falls close to a new or full moon, the two enlarging effects stack, and the result is the largest spring tide of that stretch of months.
This site has not fetched perigee dates for 2026 and 2027, so the analysis below does not label any particular day as a perigean spring tide. It does something simpler and fully traceable: it measures predicted high waters against the station's own average high.
Measuring a high tide against MHHW
A height on a tide chart is measured from mean lower low water, the zero. To judge whether a high is unusual, the useful reference is mean higher high water (MHHW), the long-term average of the higher of each day's two high waters. NOAA's datum definitions define it as "The average of the higher high water height of each tidal day observed over the National Tidal Datum Epoch."
At Portland, Maine, NOAA's datum sheet puts MHHW at 9.91 ft above MLLW. Any predicted high above that line is higher than Portland's average daily high. The MLLW and tidal datums guide shows the full ladder.
This site stores Portland's predictions from 17 October to 30 November 2026: 87 high waters. Twenty-two of them are above 9.91 ft, and they do not scatter. They come in three runs, which is what the figure at the top of the page shows.
Portland's highest predicted tides this autumn
| Run | Dates | Highest predicted high | Above MHHW (9.91 ft) |
|---|---|---|---|
| First | 25 Oct to 1 Nov | 11.198 ft, 28 Oct, 12:55 p.m. | +1.29 ft |
| Second | 6 to 10 Nov | 10.221 ft, 8 Nov, 10:02 a.m. | +0.31 ft |
| Third | 22 to 30 Nov | 11.49 ft, 26 Nov, 11:37 a.m. | +1.58 ft |
And the full third run, every high water above MHHW:
| Date | Time | Predicted high | Above MHHW |
|---|---|---|---|
| Sun 22 Nov | 8:24 a.m. | 10.214 ft | +0.30 ft |
| Mon 23 Nov | 9:09 a.m. | 10.763 ft | +0.85 ft |
| Tue 24 Nov | 9:56 a.m. | 11.185 ft | +1.28 ft |
| Wed 25 Nov | 10:45 a.m. | 11.435 ft | +1.53 ft |
| Thu 26 Nov | 11:37 a.m. | 11.49 ft | +1.58 ft |
| Fri 27 Nov | 12:30 p.m. | 11.338 ft | +1.43 ft |
| Sat 28 Nov | 1:27 p.m. | 10.993 ft | +1.08 ft |
| Sun 29 Nov | 2:27 p.m. | 10.513 ft | +0.60 ft |
| Mon 30 Nov | 3:33 p.m. | 9.995 ft | +0.08 ft |
All heights are NOAA predictions in feet above MLLW; the differences from MHHW are derived. Four patterns are worth noting:
The runs line up with the moon. US Naval Observatory moon phase data stored with this site puts a full moon on 26 October and 24 November and a new moon on 9 November (Universal Time). Each run of high highs sits around one of those dates.
The two spring tides are unequal. The new-moon run peaks only 0.31 ft above MHHW; the full-moon runs either side peak at +1.29 ft and +1.58 ft. Something beyond the moon phase is enlarging the full-moon spring tides in this stretch, which is exactly the role NOAA's tutorial gives to the moon's distance.
Only one high a day clears the line. In each run it is the late-morning or early-afternoon high; no day in the six weeks has two high waters above MHHW. On 25 November, for example, the 10:45 a.m. high is 11.435 ft and the 11:29 p.m. high is 9.753 ft, just under the line. On 26 November there is only one high water at all, because the next one slips past midnight. If you are watching for the biggest tide of a king tide day, the time matters as much as the date.
The time drifts later each day, by 44 to 66 minutes, from 8:24 a.m. on 22 November to 3:33 p.m. on 30 November. The tide times guide explains why.
The same runs are visible at nearby New Hampshire stations stored with this site. Hampton Harbor, whose predictions run to April 2027, has 21 high waters at or above 10 ft in that window, falling in runs around 27 October, 25 November, 24 December, 23 January and 21 February. Its highest is 10.546 ft on 25 December. Hampton Harbor's own datum sheet was not fetched, so those are not compared with its MHHW here.
Why king tide dates differ between sources
Search for this season's king tides and you will find lists that disagree by a day or two, or name different months altogether. That is not necessarily an error in any of them. Three things vary.
The station. Every station has its own predicted highs and its own MHHW. Nearby stations usually peak on the same day, but not at the same time or height: in the late-November run, Portland's highest predicted high is 11.49 ft at 11:37 a.m. on 26 November, and Hampton Harbor's is 10.456 ft at 11:51 a.m. the same day. Each is measured against its own average high, so a list of king tide heights built for one harbour is not a list for the coast.
The definition. Some lists use NOAA's perigean spring tide dates, which come from astronomy alone. Others use a threshold on predicted height at one station, as this guide does. Others pick the few highest tides of a season. The three methods overlap heavily but not exactly.
The clock. Moon phases are usually published in Universal Time, which is four or five hours ahead of New England. A full moon listed for early on one date can fall on the previous evening locally, and the largest tide of the run typically follows a day or two later anyway, as the spring and neap tides guide shows.
The reliable approach is to go to the predictions for the station you care about and read the highs directly. A date from a list tells you which week to look at; the station's own predicted heights tell you which tide in that week is the big one, and by how much it clears that station's average high.
King tides and the lowest tides
Spring tides stretch the range in both directions, so the days of the highest highs also bring the lowest lows. At Portland the lowest predicted low of the six weeks is -1.509 ft at 5:14 p.m. on 25 November, the same day as the second-highest high; the next lowest is -1.506 ft on 26 November. The negative low tide guide follows those minus tides over a full year.
Do king tides mean flooding?
This is the question most people bring to the term, and the honest answer has three parts.
A king tide raises the baseline. NOAA's FAQ says perigean spring tides increase the localized risk of coastal flooding because the astronomical high is already above the average high.
On its own it usually is not enough. The same FAQ states that "Along U.S. coastlines, 'high tide flooding' generally begins to occur when water levels exceed 1.5 feet above MHHW," and that in most coastal regions high tide flooding will only occur if additional factors such as wind or currents also raise the water. NOAA's high tide flooding explainer adds that it "is now twice as frequent in U.S. coastal communities as it was 20 years ago," and that it occurs when sea level rise combines with local factors.
The predictions cannot settle it. Portland's predicted highs of 11.435 ft and 11.49 ft on 25 and 26 November sit about 1.5 ft above MHHW, close to NOAA's general national figure. That is arithmetic on two published numbers, not a forecast. NOAA's 1.5 ft figure is a general one; local flood thresholds differ from place to place, the predictions leave out wind, pressure and runoff, and whether any street, beach or property is affected depends on ground elevation, which a tide prediction does not contain. The prediction vs actual water level guide shows a week in which Portland's verified water came in up to 0.87 ft above the prediction.
TideCurve does not forecast flooding and does not describe any tide as safe. For warnings, use the National Weather Service; for what the water actually did, use NOAA's observed water levels.
Finding the highest tides at your station
You do not need a king tide list to find the big highs at your own station. Open it from the list of tide charts and look at the coming weeks: high waters that climb day after day toward a peak, with lows dropping below zero at the same time, mark a spring tide, and the biggest of those are the king tides of that season. To look further ahead, the printable tide chart tool will pull any date range from NOAA; sort the high waters by height and the year's largest tides rise to the top.
With king tides explained as the largest spring tides, measured against your station's own MHHW, the label stops being a headline and becomes a number you can read off a tide table.
Sources, all retrieved 17 October 2026
- NOAA National Ocean Service, What is a king tide?
- NOAA Tides and Currents FAQ: perigean spring tides, their frequency and height, and the high tide flooding threshold.
- NOAA National Ocean Service, tides tutorial: what causes tides and tides tutorial: variations.
- NOAA National Ocean Service, What is high tide flooding?
- NOAA CO-OPS, tidal datum definitions; Portland, ME datum sheet for station 8418150, epoch 1983 to 2001, stored with this site in
docs/data/negative-low-tide.json. - NOAA CO-OPS hilo predictions for Portland, ME (8418150), 17 October to 30 November 2026, and Hampton Harbor, NH (8429489), 17 October 2026 to 16 April 2027, feet above MLLW, stored with this site. Differences from MHHW and run groupings are derived.
- US Naval Observatory moon phases, Universal Time, stored with this site in
docs/data/moon-phases-usno.json.
Frequently asked questions
What is a king tide?
King tide is a popular, non-scientific name for an exceptionally high tide. NOAA's FAQ connects it to the perigean spring tide, when a new or full moon coincides with the moon being at perigee, its closest approach to the Earth. NOAA says that happens between 6 and 8 times a year.
When are the king tides in Maine this year?
This site does not publish an official king tide calendar. What it can show is when predicted high waters are highest. At Portland, Maine, the highest predicted highs between 17 October and 30 November 2026 are 11.49 ft on 26 November and 11.435 ft on 25 November, both about 1.5 ft above the station's mean higher high water of 9.91 ft.
Do king tides cause flooding?
They can raise the risk, but NOAA's FAQ says that in most coastal regions high tide flooding occurs only if additional factors such as wind or currents also push the water up. NOAA adds that, along US coastlines, high tide flooding generally begins when water levels exceed 1.5 feet above MHHW. Local thresholds differ, and TideCurve does not forecast flooding anywhere.
How much higher is a king tide than a normal high tide?
NOAA's FAQ says perigean spring tide heights can exceed 0.5 feet or more above mean higher high water, and that high tides during a perigean spring tide are often more than a foot higher than during an apogean spring tide. At Portland, the predicted highs in late November 2026 reach about 1.6 ft above MHHW.
Is a king tide the same as a spring tide?
Not exactly. A spring tide happens twice every lunar month, at new and full moon. A perigean spring tide is the subset of spring tides that also coincide with the moon at perigee, which NOAA puts at 6 to 8 times a year. Those produce the largest spring tides, which is why the king tide name sticks to them.
Are king tides also extra-low tides?
Usually, yes. Spring tides raise high waters and lower low waters together, so the same days tend to bring the deepest negative low tides. At Portland, the lowest predicted low between 17 October and 30 November 2026 is -1.509 ft on 25 November, the same day as one of the two highest highs.